. 2022 Jun 13;28(16):3546–3556. doi: 10.1158/1078-0432.CCR-22-0368

Figure 4.

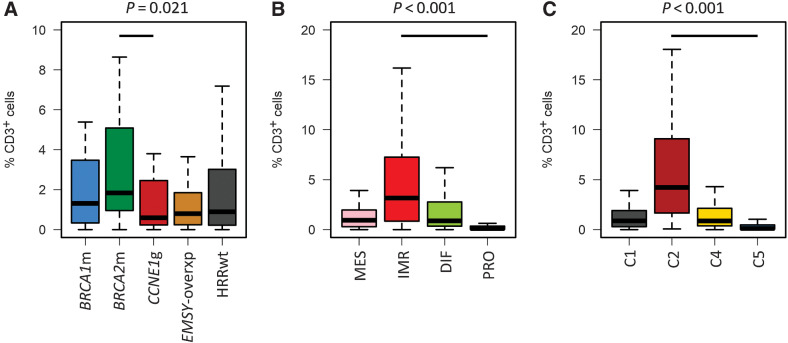
Figure 4. Tumor-infiltrating immune cells across high-grade serous carcinoma subtypes. A, CD3+ infiltration across HRR-centric subtypes; labeled P value represents comparison of BRCA2m and CCNE1g groups using the Mann–Whitney U test. B, CD3+ infiltration across TCGA transcriptomic subtypes; labeled P value represents comparison of IMR and PRO groups using the Mann–Whitney U test. C, CD3+ infiltration across Tothill transcriptomic subtypes; labeled P value represents comparison of C2 and C5 groups using the Mann–Whitney U test. BRCA2m, BRCA2 mutant; BRCA1m, BRCA1 mutant; EMSY-overxp; overexpression of EMSY; CCNE1g, gain of CCNE1; HRRwt, non-CCNE1g HRR wild-type.

Tumor-infiltrating immune cells across high-grade serous carcinoma subtypes. A, CD3+ infiltration across HRR-centric subtypes; labeled P value represents comparison of BRCA2m and CCNE1g groups using the Mann–Whitney U test. B, CD3+ infiltration across TCGA transcriptomic subtypes; labeled P value represents comparison of IMR and PRO groups using the Mann–Whitney U test. C, CD3+ infiltration across Tothill transcriptomic subtypes; labeled P value represents comparison of C2 and C5 groups using the Mann–Whitney U test. BRCA2m, BRCA2 mutant; BRCA1m, BRCA1 mutant; EMSY-overxp; overexpression of EMSY; CCNE1g, gain of CCNE1; HRRwt, non-CCNE1g HRR wild-type.