. 2022 Feb 18;10(4):437–452. doi: 10.1158/2326-6066.CIR-20-0973

Figure 5.

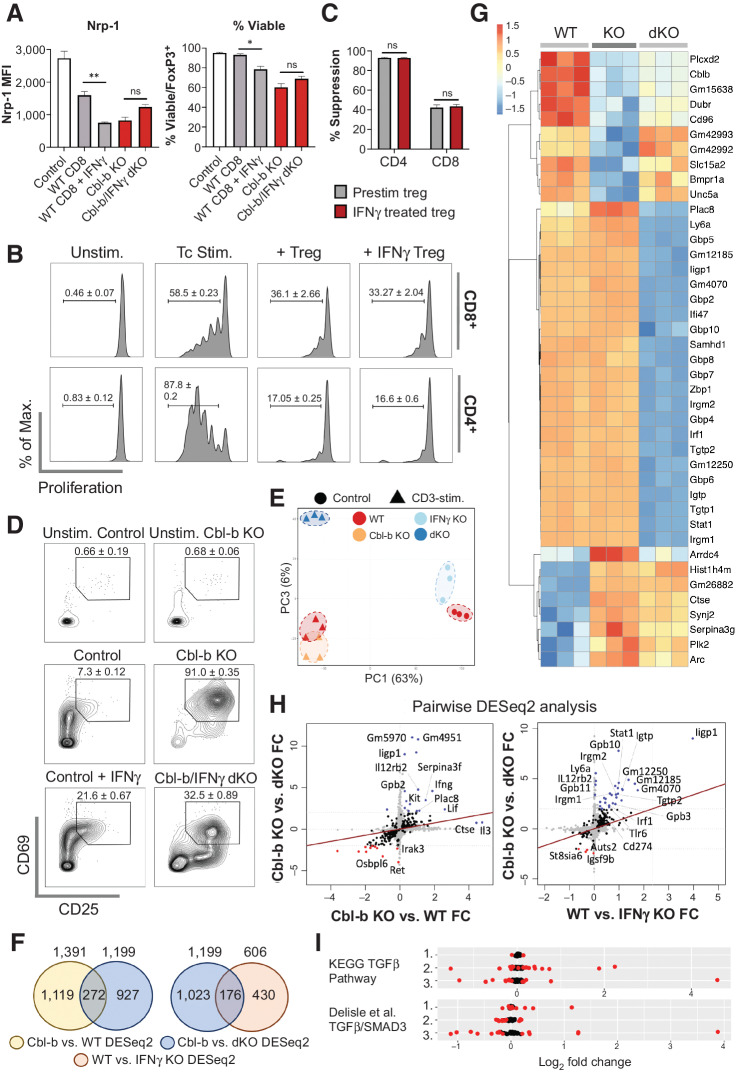
Figure 5. IFNγ directly modulates Cbl-b KO CD8+ T-cell responses. A, The effect of IFNγ on Tregs in suppression assay. Purified CD25+FoxP3+ Tregs were cocultured with WT CD8+ T cells (with or without IFNγ), Cbl-b KO, or Cbl-b/IFNγ double KO CD8+ T cells for 3 days; Nrp-1 expression on viable FoxP3+ cells and the percentage of viable cells within FoxP3+ cells were measured (n = 3). B, Proliferation of WT CD8+ and WT CD4+ T cells in the presence of preactivated Tregs treated with or without IFNγ (n = 3). C, The percentage suppression of WT CD4+ and CD8+ T cells cocultured with Tregs treated with or without IFNγ. D, CD69 and CD25 expression on activated WT, Cbl-b KO, and Cbl-b/IFNγ double KO CD8+ T cells (without Tregs). T cells were stimulated for 24 hours. E–I, Transcriptomic analyses of WT, Cbl-b KO, and Cbl-b/IFNγ double KO CD8+ T cells (n = 3). E, PCA of CD8+ T cells from different stimulatory conditions. F, Venn diagrams representing the total number of unique and overlapping differentially expressed genes for each DESeq2. G, A heatmap representing differentially expressed genes of each stimulated group. Values were calculated using individual gene's Z-normalized log2 score (RNA-seq read count + 1). H, Pairwise analyses comparing differentially expressed genes between Cbl-b KO vs. Cbl-b/IFNγ double KO DESeq2, Cbl-b KO vs. WT DESeq2 and WT vs. IFNγ KO DESeq2. Blue and red points indicate upregulated and downregulated genes in each condition, respectively. I, TGFβ signaling pathway analysis using KEGG and Delisle et al. data set (35). Genes represented in each TGFβ signaling dataset were analyzed in WT vs. IFNγ KO (1), Cbl-b KO vs. WT (2), and Cbl-b KO vs. Cbl-b/IFNγ double KO (3) DESeq2 datasets. DEGs with P < 0.05 were annotated in red.

IFNγ directly modulates Cbl-b KO CD8+ T-cell responses. A, The effect of IFNγ on Tregs in suppression assay. Purified CD25+FoxP3+ Tregs were cocultured with WT CD8+ T cells (with or without IFNγ), Cbl-b KO, or Cbl-b/IFNγ double KO CD8+ T cells for 3 days; Nrp-1 expression on viable FoxP3+ cells and the percentage of viable cells within FoxP3+ cells were measured (n = 3). B, Proliferation of WT CD8+ and WT CD4+ T cells in the presence of preactivated Tregs treated with or without IFNγ (n = 3). C, The percentage suppression of WT CD4+ and CD8+ T cells cocultured with Tregs treated with or without IFNγ. D, CD69 and CD25 expression on activated WT, Cbl-b KO, and Cbl-b/IFNγ double KO CD8+ T cells (without Tregs). T cells were stimulated for 24 hours. E–I, Transcriptomic analyses of WT, Cbl-b KO, and Cbl-b/IFNγ double KO CD8+ T cells (n = 3). E, PCA of CD8+ T cells from different stimulatory conditions. F, Venn diagrams representing the total number of unique and overlapping differentially expressed genes for each DESeq2. G, A heatmap representing differentially expressed genes of each stimulated group. Values were calculated using individual gene's Z-normalized log2 score (RNA-seq read count + 1). H, Pairwise analyses comparing differentially expressed genes between Cbl-b KO vs. Cbl-b/IFNγ double KO DESeq2, Cbl-b KO vs. WT DESeq2 and WT vs. IFNγ KO DESeq2. Blue and red points indicate upregulated and downregulated genes in each condition, respectively. I, TGFβ signaling pathway analysis using KEGG and Delisle et al. data set (35). Genes represented in each TGFβ signaling dataset were analyzed in WT vs. IFNγ KO (1), Cbl-b KO vs. WT (2), and Cbl-b KO vs. Cbl-b/IFNγ double KO (3) DESeq2 datasets. DEGs with P < 0.05 were annotated in red.