. 2022 Jun 8;28(16):3590–3602. doi: 10.1158/1078-0432.CCR-22-0296

Figure 1.

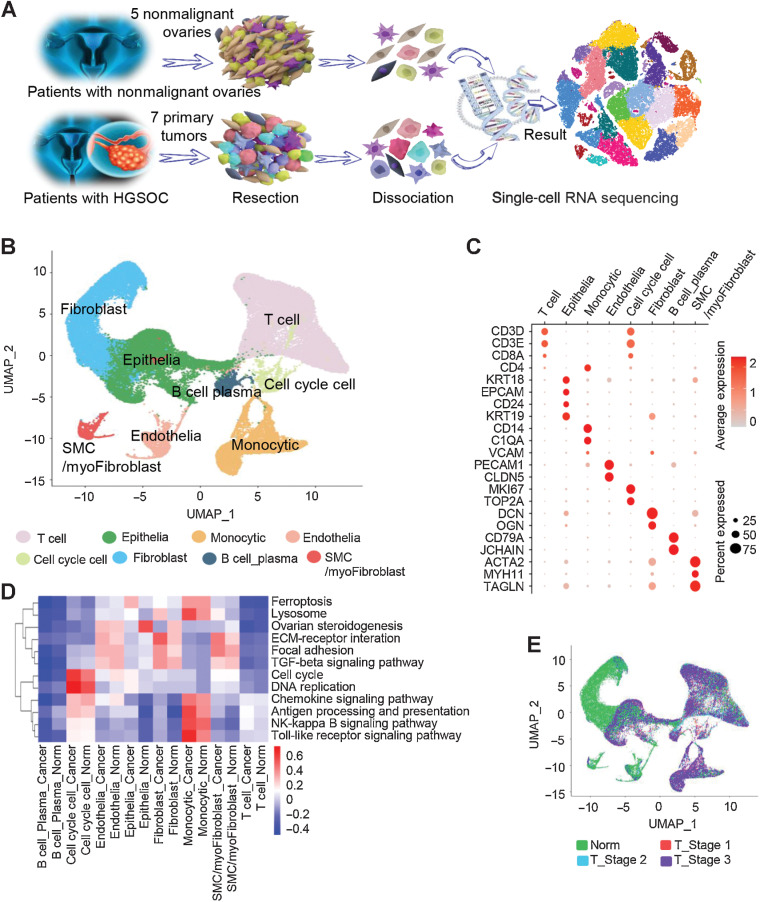
Figure 1. Diverse cell types in HGSOC and nonmalignant ovarian tissues delineated by single-cell transcriptomic analysis. A, Workflow depicting the collection and processing of specimens of HGSOC tumors and nonmalignant ovarian tissues for scRNA-seq. B, The UMAP plot demonstrates the main cell types in HGSOC and control ovarian tissues. C, Dot plots showing the expression levels of specific marker genes in each cell type. The size of dots indicates the proportion of cells expressing the particular marker gene. The spectrum of color represents the mean expression levels of the marker genes. D, Heatmap showing differentially activated pathways of each cell type in the HGSOC and nonmalignant groups. E, Cell composition distribution for each group with different clinical stages.

Diverse cell types in HGSOC and nonmalignant ovarian tissues delineated by single-cell transcriptomic analysis. A, Workflow depicting the collection and processing of specimens of HGSOC tumors and nonmalignant ovarian tissues for scRNA-seq. B, The UMAP plot demonstrates the main cell types in HGSOC and control ovarian tissues. C, Dot plots showing the expression levels of specific marker genes in each cell type. The size of dots indicates the proportion of cells expressing the particular marker gene. The spectrum of color represents the mean expression levels of the marker genes. D, Heatmap showing differentially activated pathways of each cell type in the HGSOC and nonmalignant groups. E, Cell composition distribution for each group with different clinical stages.