Figure 2.
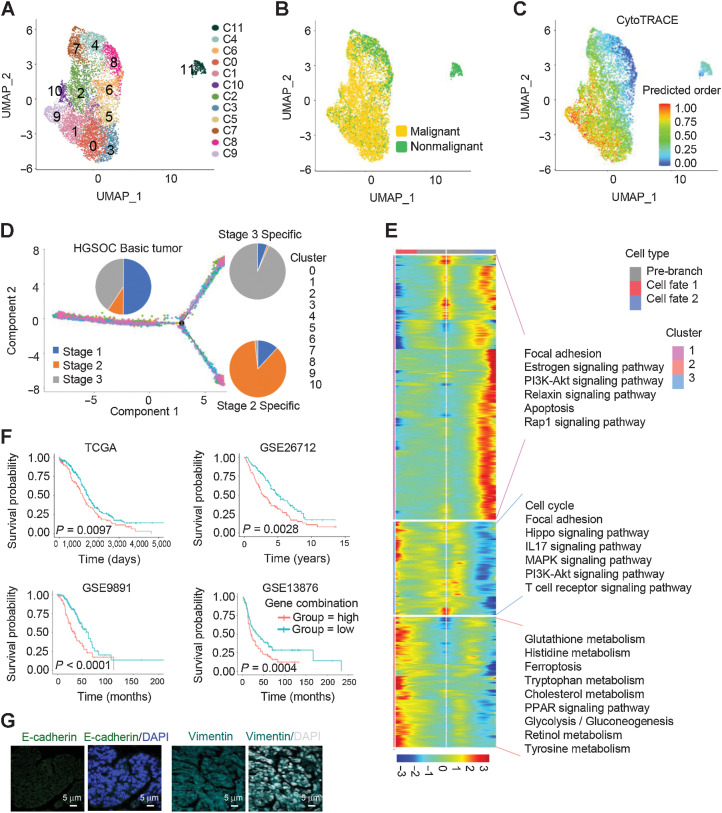
Differential gene expression signatures and impact of EMT-associated genes on HGSOC tumors. A, UMAP plot with clusters demarcated by colors demonstrating 12 distinct clusters based on gene expression differences for 14,636 epithelial cells passing quality control. B, The UMAP plot demarcated by colors showing the two groups of HGSOC tumors (malignant) and nonmalignant ovarian tissues. C, CytoTRACE analysis of epithelial cells. D, Pseudotime analysis of malignant epithelial cells inferred by Monocle2. Each point corresponds to a single cell. Cluster and stage information is shown. E, The differentially expressed genes (rows) along the pseudotime (columns) were hierarchically clustered into three subclusters. The representative annotated pathways of each subcluster are provided. F, The combination of NOTCH1, SNAI2, WNT11, and TGFBR1 expression was associated with worse patient OS in TCGA HGSOC cohort, GSE26712 HGSOC cohort, GES9891 serous ovarian cancer cohort, and GSE13876 serous ovarian cancer cohort, respectively. P values were calculated by a log-rank test. G, IF staining with anti–E-cadherin and vimentin antibodies in HGSOC tissue sections.

