. 2022 Jun 8;28(16):3590–3602. doi: 10.1158/1078-0432.CCR-22-0296

Figure 3.

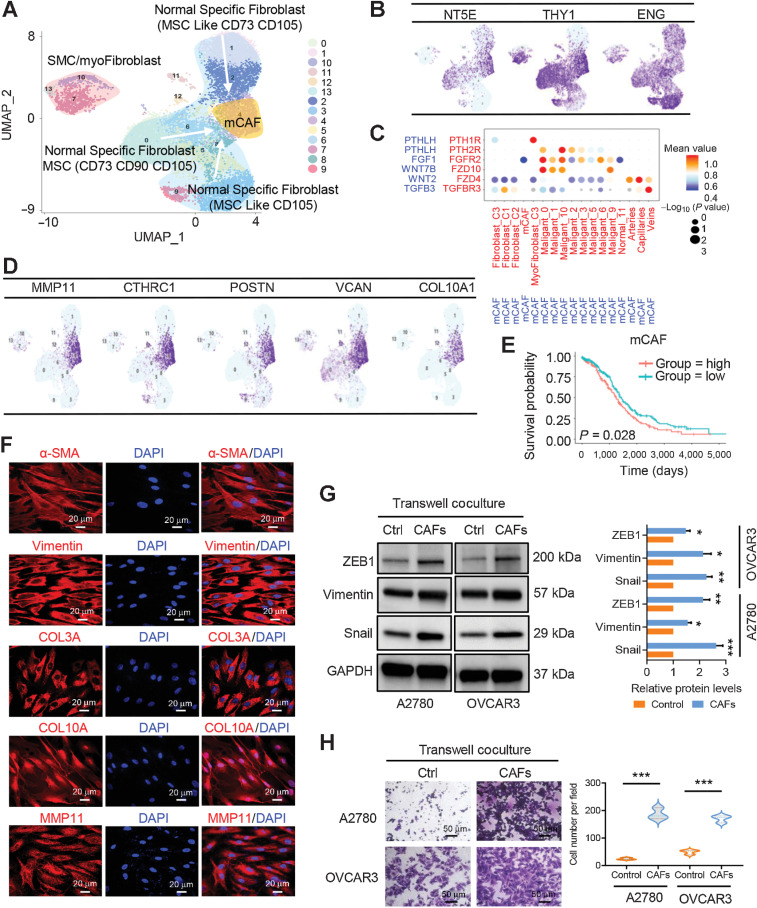
Figure 3. Fibroblast clusters in nonmalignant ovarian tissues and HGSOC tumors. A, UMAP plot with clusters demarcated by colors demonstrating 14 distinct clusters based on gene expression differences for 13,201 fibroblasts. B, UMAP plot color coded for the expression (blue to purple) of marker genes for the clusters of nonmalignant fibroblasts as indicated. C, Dot plot of the cross-compartment chemokine ligand and corresponding chemokine receptor expression by the cell type of the mCAF and TME. The color intensity of each dot represents the mean scran-normalized expression across all patients. The size of dots indicates the proportion of cells that express a gene relative to the total number of cells in that cell type. D, UMAP plot color coded for the expression (blue to purple) of marker genes for the mCAFs. E, Kaplan–Meier OS curves of patients with TCGA HGSOC grouped by the top 10-gene signature of mCAF markers. P values were calculated by a log-rank test. F, IF staining of α-SMA, vimentin, COL3A, COL10A, and MMP11 in primary CAFs derived from HGSOC ascites. G, Protein expression levels of mesenchymal biomarkers including ZEB1, vimentin, and snail were analyzed in ovarian cancer A2780 and OVCAR3 cells alone or transwell cocultured with primary CAFs by Western blot analysis. The protein expression levels were normalized with GAPDH. The normalized value of the control group was set to 1, and the relative protein levels of the sample group are shown as mean ± SD. The results were averaged from three independent experiments. H, Representative images for the invasion analysis of A2780 and OVCAR3 cells alone or transwell cocultured with primary CAFs. Data are mean ± SD from three independent experiments. *, P < 0.05; **, P < 0.01; ***, P < 0.001.

Fibroblast clusters in nonmalignant ovarian tissues and HGSOC tumors. A, UMAP plot with clusters demarcated by colors demonstrating 14 distinct clusters based on gene expression differences for 13,201 fibroblasts. B, UMAP plot color coded for the expression (blue to purple) of marker genes for the clusters of nonmalignant fibroblasts as indicated. C, Dot plot of the cross-compartment chemokine ligand and corresponding chemokine receptor expression by the cell type of the mCAF and TME. The color intensity of each dot represents the mean scran-normalized expression across all patients. The size of dots indicates the proportion of cells that express a gene relative to the total number of cells in that cell type. D, UMAP plot color coded for the expression (blue to purple) of marker genes for the mCAFs. E, Kaplan–Meier OS curves of patients with TCGA HGSOC grouped by the top 10–gene signature of mCAF markers. P values were calculated by a log-rank test. F, IF staining of α-SMA, vimentin, COL3A, COL10A, and MMP11 in primary CAFs derived from HGSOC ascites. G, Protein expression levels of mesenchymal biomarkers including ZEB1, vimentin, and snail were analyzed in ovarian cancer A2780 and OVCAR3 cells alone or transwell cocultured with primary CAFs by Western blot analysis. The protein expression levels were normalized with GAPDH. The normalized value of the control group was set to 1, and the relative protein levels of the sample group are shown as mean ± SD. The results were averaged from three independent experiments. H, Representative images for the invasion analysis of A2780 and OVCAR3 cells alone or transwell cocultured with primary CAFs. Data are mean ± SD from three independent experiments. *, P < 0.05; **, P < 0.01; ***, P < 0.001.