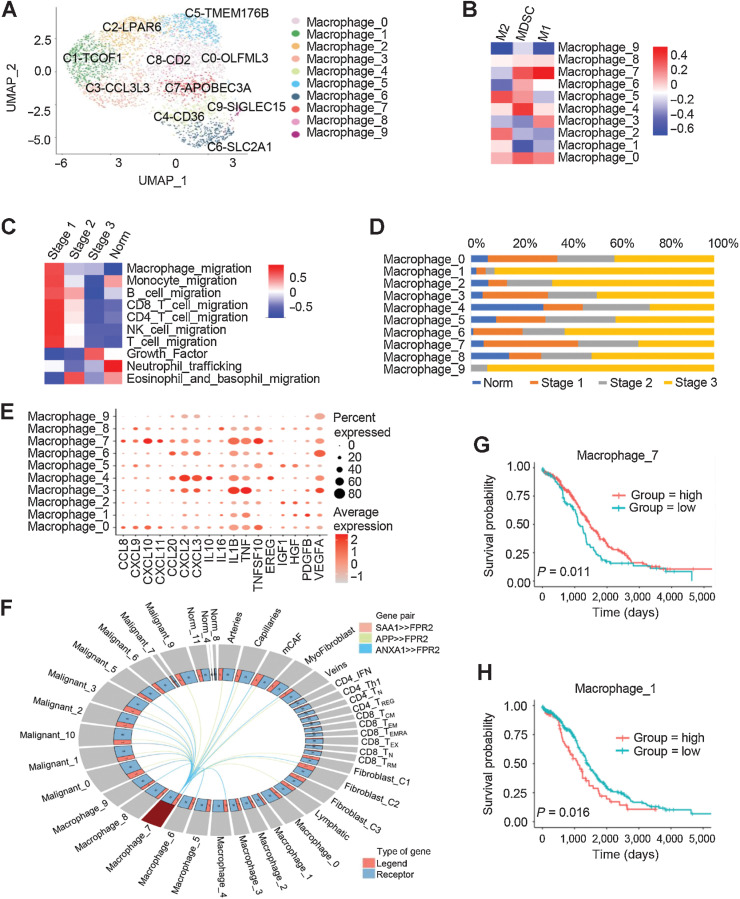
Figure 4.
Characteristics of macrophages in different tumor stages. A, UMAPs of macrophages from all patients, colored by the identified cell subpopulations. B, Heatmap depicting the gene enrichment for classical cell types M1, M2, and MDSCs in comparison with the macrophage subclusters. C, Heatmap showing differentially activated pathways of each clinical stage in the HGSOC and nonmalignant groups. D, Macrophage cell-type fractions relative to the total macrophage cell count in each clinical stage group. Each stacked bar represents a cluster for which the total macrophage cell count was scaled to 1. E, Dot plots showing the expression levels of specific chemokine genes in each macrophage cluster. F, Model of the cross-compartment chemokine ligand-receptor interactions between macrophage_7 and the TME. OS for patients further stratified according to macrophage_7 (G) and macrophage_1 (H) signature expression. Log-rank P values are shown.

