. 2022 Jun 8;28(16):3590–3602. doi: 10.1158/1078-0432.CCR-22-0296

Figure 5.

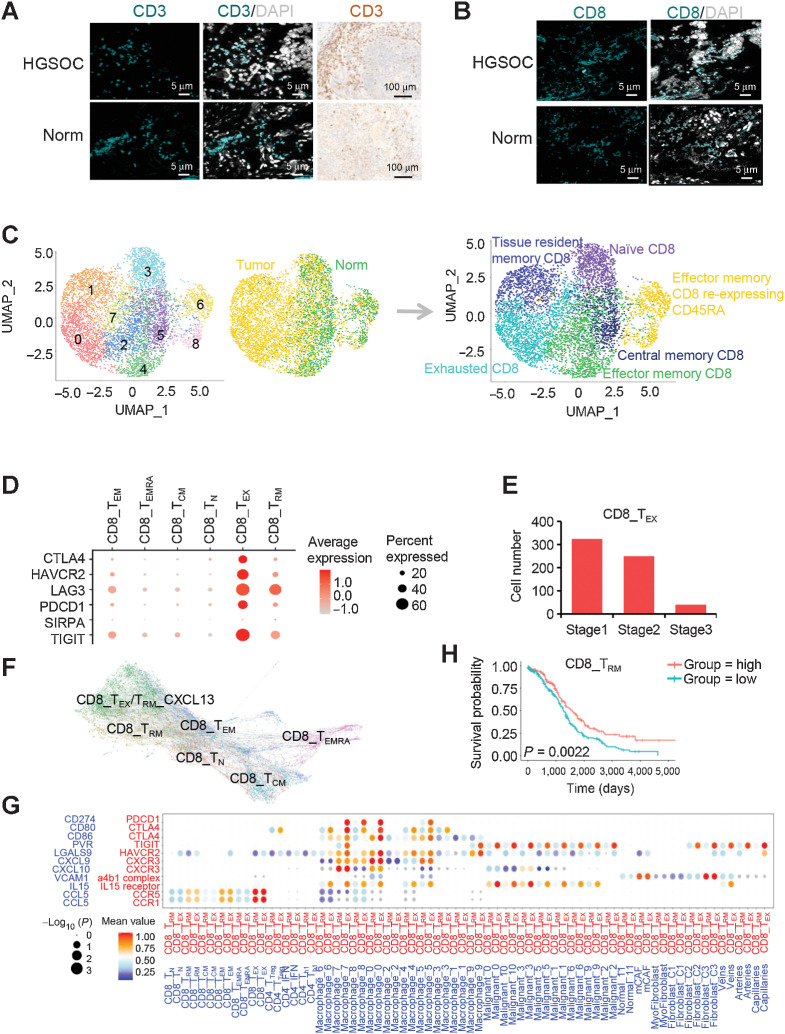
Figure 5. Cell clustering and functional annotation of CD8+ T cells in HGSOC and nonmalignant ovarian tissues. A, Detection of CD3 (green) in T cells by IF staining in HGSOC and nonmalignant ovarian tissues. Nuclei were stained with DAPI (gray). The validation of CD3 was also confirmed by IHC. B, Detection of CD8 (green) in T cells by IF staining in HGSOC and nonmalignant ovarian tissues. Nuclei were stained with DAPI (gray). C, UMAPs of CD8+ T cells from all patients, colored by the identified cell subpopulations. D, Dot plot of the average expression of CTLA4, HAVCR2, LAG3, PDCD1, SIRPA, and TIGIT in CD8+ T-cell subpopulations. E, Bar plots showing the fraction of CD8+ TEX cells relative to the total CD8+ T count grouped by tumor stage. F, PAGA pseudospatial trajectory analysis of six colored CD8+ T-cell subclusters. G, Dot plot of the cross-compartment chemokine ligand and corresponding receptor expression by cell type of the CD8+ TRM /TEX and TME. H, Kaplan–Meier survival curves for OS from n = 373 primary HGSOCs showing significant prognostic separation according to the CD8+ TRM marker gene signature derived from single-cell data. Log-rank P values are shown.

Cell clustering and functional annotation of CD8+ T cells in HGSOC and nonmalignant ovarian tissues. A, Detection of CD3 (green) in T cells by IF staining in HGSOC and nonmalignant ovarian tissues. Nuclei were stained with DAPI (gray). The validation of CD3 was also confirmed by IHC. B, Detection of CD8 (green) in T cells by IF staining in HGSOC and nonmalignant ovarian tissues. Nuclei were stained with DAPI (gray). C, UMAPs of CD8+ T cells from all patients, colored by the identified cell subpopulations. D, Dot plot of the average expression of CTLA4, HAVCR2, LAG3, PDCD1, SIRPA, and TIGIT in CD8+ T-cell subpopulations. E, Bar plots showing the fraction of CD8+ TEX cells relative to the total CD8+ T count grouped by tumor stage. F, PAGA pseudospatial trajectory analysis of six colored CD8+ T-cell subclusters. G, Dot plot of the cross-compartment chemokine ligand and corresponding receptor expression by cell type of the CD8+ TRM /TEX and TME. H, Kaplan–Meier survival curves for OS from n = 373 primary HGSOCs showing significant prognostic separation according to the CD8+ TRM marker gene signature derived from single-cell data. Log-rank P values are shown.