. 2022 Jun 29;28(15):3268–3276. doi: 10.1158/1078-0432.CCR-22-0666

Figure 2.

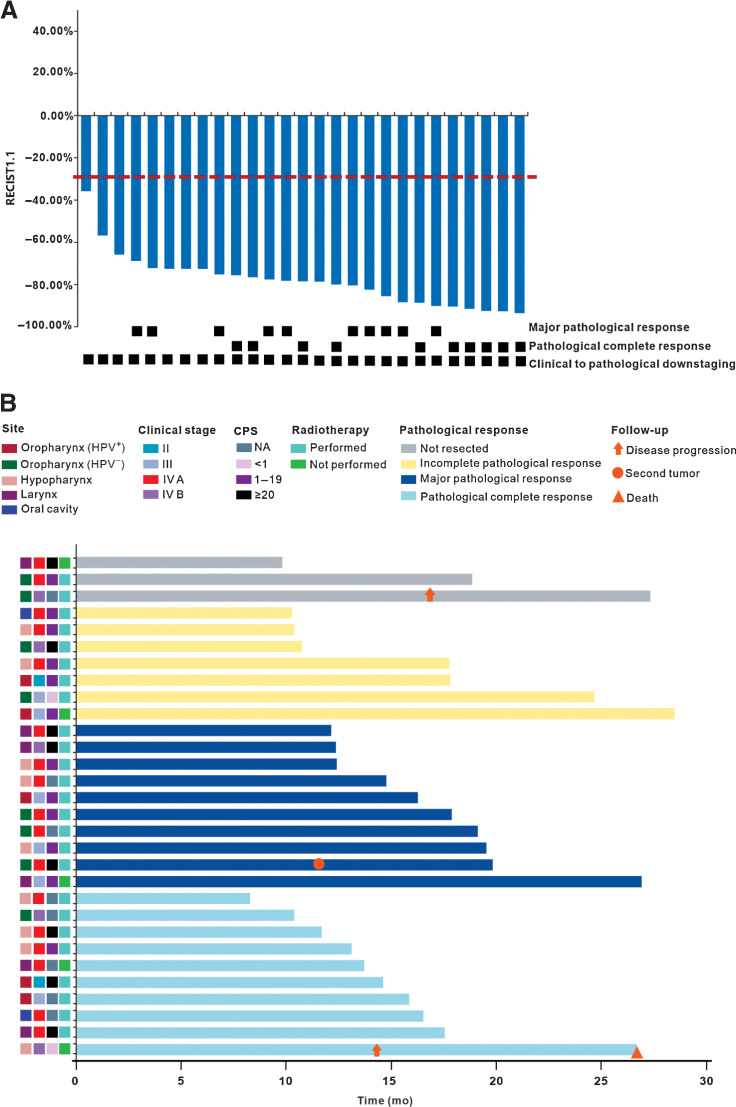
Figure 2. Tumor response. A, Treatment response of individual patients who underwent surgery (n = 27). The red horizontal line represents 30% target lesion reduction. B, Swimming plot of disease-free survival for individual patients (n = 30). HPV, human papilloma virus; CPS, combined positive score; NA, not available.

Tumor response. A, Treatment response of individual patients who underwent surgery (n = 27). The red horizontal line represents 30% target lesion reduction. B, Swimming plot of disease-free survival for individual patients (n = 30). CPS, combined positive score; HPV, human papilloma virus; NA, not available.