. 2021 Jul 2;81(16):4205–4217. doi: 10.1158/0008-5472.CAN-21-0086

Figure 2.

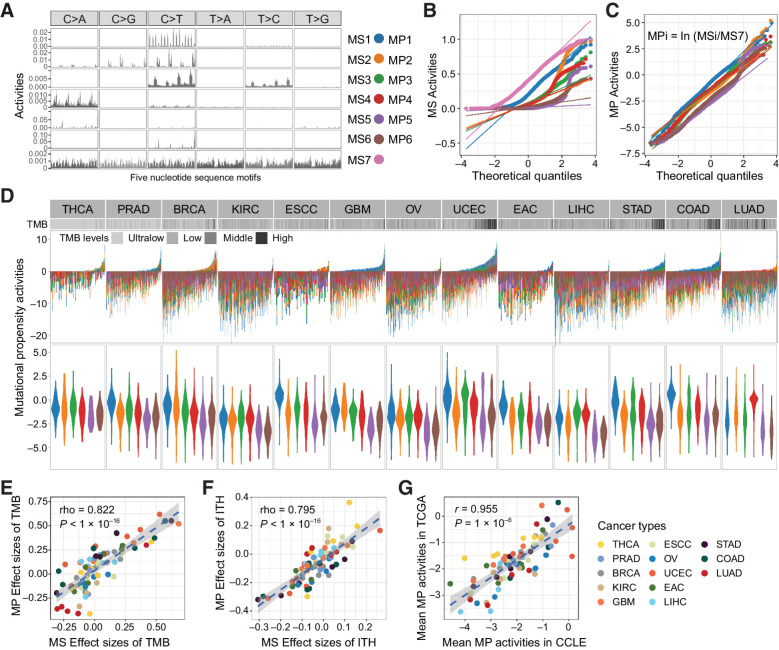
Figure 2. The mutational propensities in thirteen cancer types. A, The conserved MSs based on 5-nucleotide context are correlated with COMISC single-base substitution signatures. B, The quantile–quantile plot shows the abnormal distribution of the MSs at pan-cancer level. C, The quantile–quantile plot shows the quasi-normal distribution of the MPs at pan-cancer level. D, The MPs of each individual in different TCGA cancer types. Each bar represents an individual. The cancer types are ranked from left to right in the order of increased median TMB. In each cancer type, the individuals are ranked from left to the right in the order of decreased activities of the MS7. Different colors represent different MPs. E, The MP and the MS activities show consistent effects (Spearman correlation) on TMB. The effect sizes are calculated as Spearman rho between MP or MS and TMB. F, The MP and the MS activities show consistent effects (Spearman correlation) on ITH. The effect sizes are calculated as Spearman rho between MP or MS and TMB. G, The MPs are highly consistent between TCGA cancer tissues and CCLE cancer cell lines representing the same cancer types.

The mutational propensities in thirteen cancer types. A, The conserved MSs based on 5-nucleotide context are correlated with COMISC single-base substitution signatures. B, The quantile–quantile plot shows the abnormal distribution of the MSs at pan-cancer level. C, The quantile–quantile plot shows the quasi-normal distribution of the MPs at pan-cancer level. D, The MPs of each individual in different TCGA cancer types. Each bar represents an individual. The cancer types are ranked from left to right in the order of increased median TMB. In each cancer type, the individuals are ranked from left to the right in the order of decreased activities of the MS7. Different colors represent different MPs. E, The MP and the MS activities show consistent effects (Spearman correlation) on TMB. The effect sizes are calculated as Spearman rho between MP or MS and TMB. F, The MP and the MS activities show consistent effects (Spearman correlation) on ITH. The effect sizes are calculated as Spearman rho between MP or MS and TMB. G, The MPs are highly consistent between TCGA cancer tissues and CCLE cancer cell lines representing the same cancer types.