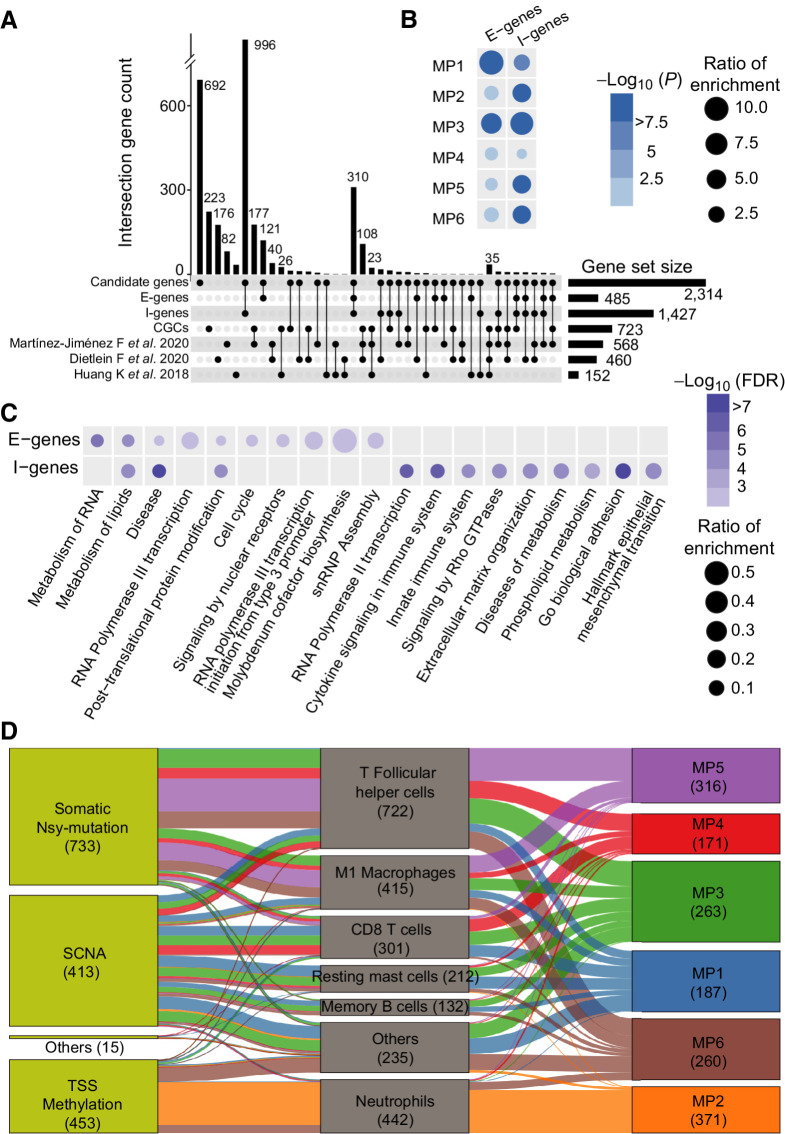
Figure 4.
The E-genes and I-genes influence the mutational propensities. A, The Upset plot shows the overlap between the E-genes, I-genes, COSMIC CGCs, and another three published benchmark cancer gene sets. B, The E-genes and I-genes are enriched for determinants of different MPs at the pan-cancer level based on the background of 2,314 candidate genes. The dot color represents the −log10 (FDR). The dot size represents the OR of enrichment based on the background of 2,314 candidate genes. C, The pathways enriched in E-genes and I-genes. The dot color represents the −log10 (FDR). The dot size represents the OR of enrichment. D, The I-genes impact on the MPs through different immune cell activities in TIME.

