. 2021 Jul 2;81(16):4205–4217. doi: 10.1158/0008-5472.CAN-21-0086

Figure 6.

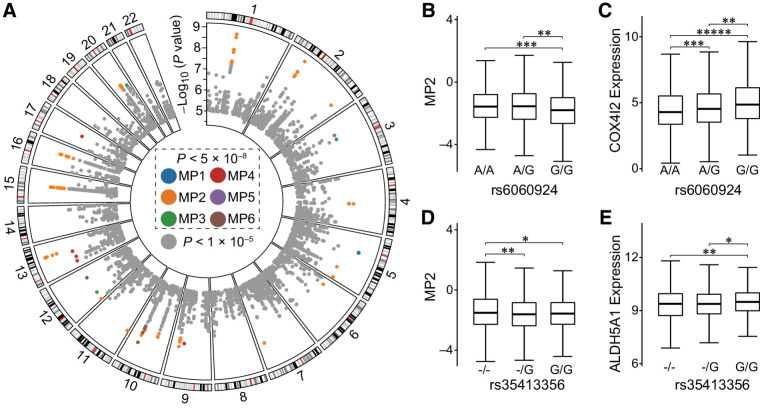
Figure 6. The quantitative loci of the mutational propensities. A, The genomic distribution of the SNP loci. Each box represents a chromosome and each dot a SNP locus. The different colors represent the different MPs significantly associated. The colored dots represent the mpQTLs that reached genome-wide significance (P < 5.0 × 10⁻⁸), and the rest of SNPs are labeled in gray. B and C, The associations among the rs6060924 genotypes with the MP2 and the COX4I2 expression. D and E, The associations among the rs35413356 genotypes with the MP2 and the ALDH5A1 expression. The P values are based on Student t test. *, P < 0.05; **, P < 0.01; ***, P < 1.0 × 10⁻³; ****, P < 1.0 × 10⁻⁴; *****, P < 1.0 × 10⁻⁵.

The quantitative loci of the mutational propensities. A, The genomic distribution of the SNP loci. Each box represents a chromosome and each dot a SNP locus. The different colors represent the different MPs significantly associated. The colored dots represent the mpQTLs that reached genome-wide significance (P < 5.0 × 10⁻⁸), and the rest of SNPs are labeled in gray. B and C, The associations among the rs6060924 genotypes with the MP2 and the COX4I2 expression. D and E, The associations among the rs35413356 genotypes with the MP2 and the ALDH5A1 expression. The P values are based on Student t test. *, P < 0.05; **, P < 0.01; ***, P < 1.0 × 10⁻³; ****, P < 1.0 × 10⁻⁴; *****, P < 1.0 × 10⁻⁵.