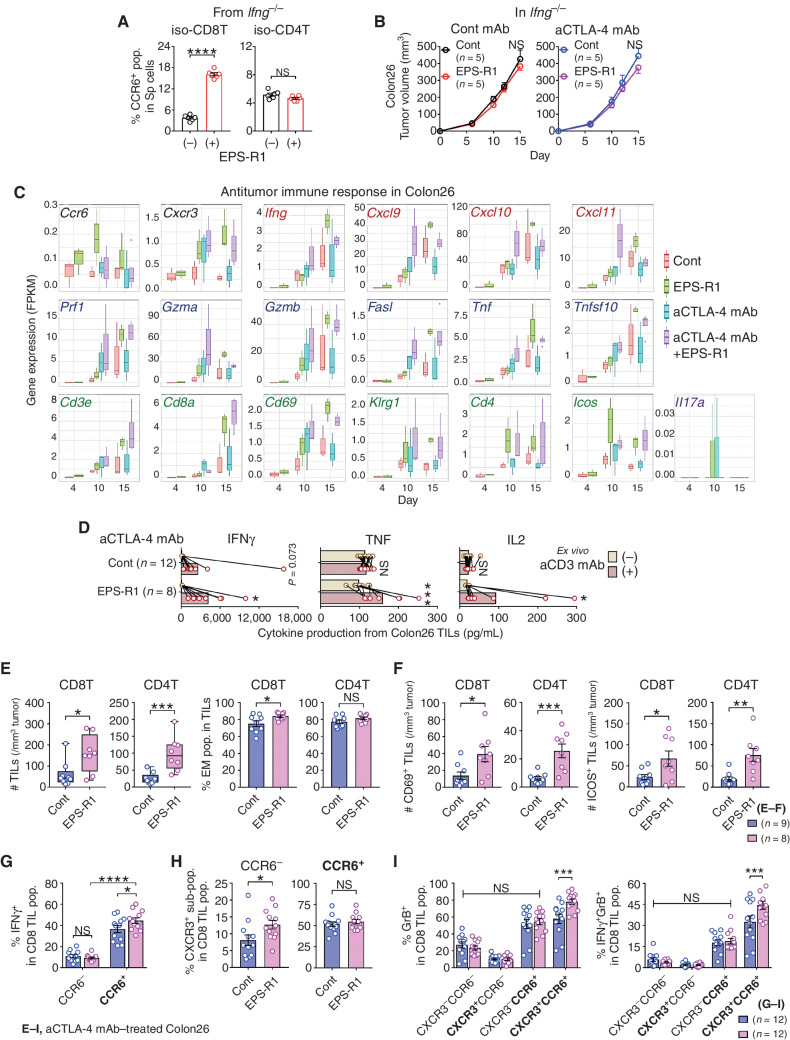
Figure 4.
Preferentially infiltrating CCR6+ CD8+ T cells increase effector CD8+ T cells in anti–CTLA-4 mAb/EPS-R1–treated Colon26 tumors. A, CD8+ or CD4+ T cells were isolated from splenocytes of BALB/c Ifng−/− mice and stimulated with EPS-R1 for 24 hours in vitro. CCR6+ populations among CD8+ or CD4+ T cells were examined by flow cytometry (n = 6). B, BALB/c Ifng−/− mice were subcutaneously inoculated with Colon26 tumor cells, and dietary ingestion of EPS-R1 was started on day 0. Some mice were i.p. treated with anti–CTLA-4 mAb. Tumor volumes were periodically measured and statistically compared on day 15. Tumor growth among anti–CTLA-4 mAb–treated mice was not significantly different from that in control mice. C, RNA samples were obtained from Colon26 tumors in BALB/c WT mice treated with anti–CTLA-4 mAb and/or EPS-R1 ingestion on day 4, 10, and 15. Then, RNA-seq analysis was performed on individual samples (n = 3–4 in every group). Fragments per kilobase of exon per million reads mapped (FPKM) of 19 selected antitumor immune response–related genes are presented. D–I, CD45+ single-cell suspensions were prepared from Colon26 tumors in BALB/c WT mice treated with anti–CTLA-4 mAb with or without EPS-R1 ingestion on day 15. These cells were stimulated with anti-CD3 mAb ex vivo and cell-free culture supernatants were harvested 48 hours later, and then the amounts of IFNγ, TNF, and IL2 were examined by ELISA (n = 12 in control and n = 8 in EPS-R1; D). The number of CD8+ or CD4+ T cells per 1 mm3 tumor and the population of EM phenotype (CD44hi CD62L−) cells among CD8+ or CD4+ T cells (n = 9 in control and n = 8 in EPS-R1; E), the number of CD69- or ICOS-expressing CD8+ or CD4+ T cells per 1 mm3 tumor (n = 9 in control and n = 8 in EPS-R1; F), IFNγ+ population among CCR6-expressing CD8+ T cells (n = 12; G), CXCR3+ population among CCR6− or CCR6+ CD8+ T cells (n = 12; H), and granzyme B+ or IFNγ+ granzyme B+ (double-positive) population among CXCR3- and/or CCR6-expressing CD8+ T cells (n = 12; I) were examined by flow cytometry. Results are presented as the mean ± SEM and are depicted as scatter plots of the results of individual samples (A, E in % EM, and F–I), mean ± SEM (B), box plots (C), dot plots with mean and line connected between the results using the same samples (D), or box plots with individual samples (E in # TILs). Number (n) of mice in every group is indicated in the panels (B). Statistical analyses were performed by Student t test (A, B, E in % EM, F, and H), two-way ANOVA with Bonferroni correction (D, G, and I) or Mann–Whitney U test (E in # TILs). NS, not significant. *, P < 0.05; **, P < 0.01; ***, P < 0.001; ****, P < 0.0001. Similar results were obtained from two independent experiments (A, B, and G–I). All the results obtained from two independent experiments are presented (D). aCD3, anti-CD3ε; aCTLA-4, anti–CTLA-4; CD8(4)T, CD8(4)+ T cell(s); cont, control; GrB, granzyme B; iso, isolated; pop., population(s); Sp, spleen. Bold font in G–I is used to highlight positive expressing markers.

