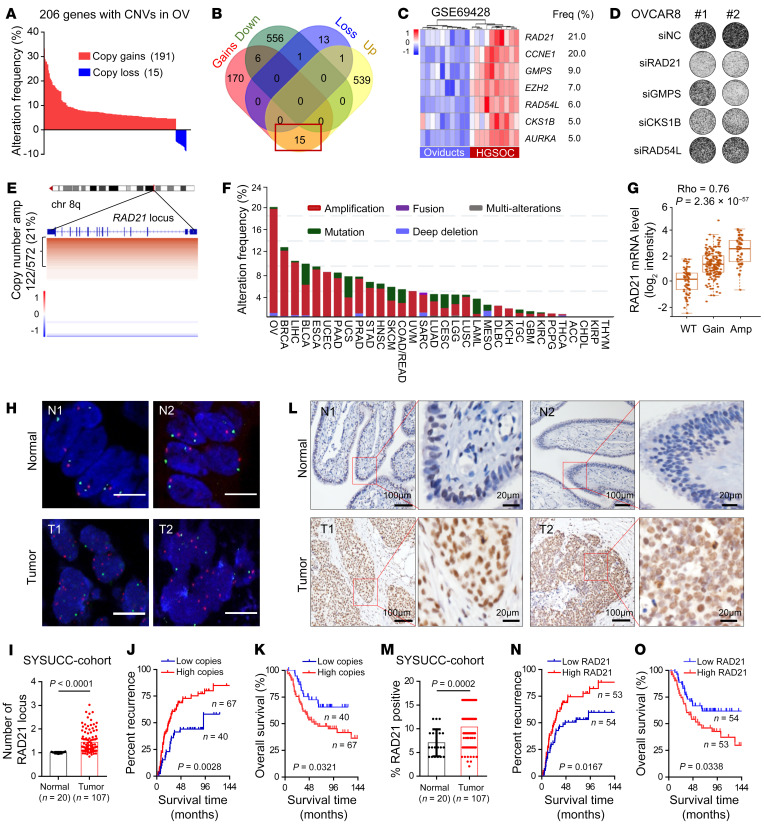
Figure 1. RAD21 is a critical CNA gene and amplified RAD21 correlates with poor prognosis in HGSOC.
(A) Bar graph showing the CNA frequencies (191 copy gains and 15 copy loss) in the TCGA-OV database. (B) Venn diagram showing the overlap of 206 CNAs and DEGs in human OV in the TCGA database (TCGA-OV transcriptome_U133A-seq database, adjusted P value < 0.01, |log2foldchange| > 1). (C) Heatmap for upregulated genes (adjusted P value < 0.01) in 10 pairs of independent patients from GSE69428 database. (D) Representative images of colony formation assay in OVCAR8 cells transfected with scramble siRNA or 2 individual siRNAs targeting RAD21, GMPS, CKS1B, and RAD54L, respectively. (E) Integrative Genomics Viewer heatmap displays the CNAs on the RAD21 locus, obtained from data of OV in cBioportal (n = 572; copy number amplification was defined as copy number score > 0.3). (F) Genetic alteration frequency of RAD21 in TCGA pan-cancer database. (G) Correlation analysis showing an increase in RAD21 mRNA level concordant with the gain of an additional DNA copy (Gain) and/or multiple copies (Amp) (Spearman ρ = 0.76; P = 2.36 × 10–57). (H and I) Representative images (H) and quantification (I) of FISH showing RAD21 locus in ovarian tumor (n = 107) and normal fallopian tube tissue (n = 20) from SYSUCC cohort. Blue, DNA stained with DAPI; green, centromere of chromosome 8; red, genomic locus of RAD21 gene. Scale bars: 5 μm. (J and K) Kaplan-Meier curves of recurrence time (J) and overall survival rates (K) in patients with OV grouped according to high (red, n = 67) and low (blue, n = 40) copies of RAD21 (log-rank test). (L and M) Representative IHC staining (L) and quantification (M) showing RAD21 expression in ovarian tumor (n = 107) and normal fallopian tube tissue (n = 20) from SYSUCC cohort. (N and O) Kaplan-Meier curves of recurrence time (N) and overall survival rates (O) in patients with OV grouped according to high (red, n = 53) and low (blue, n = 54) expression of RAD21 (log-rank test). Data in I and M are shown as mean ± SD (2-tailed t test).

