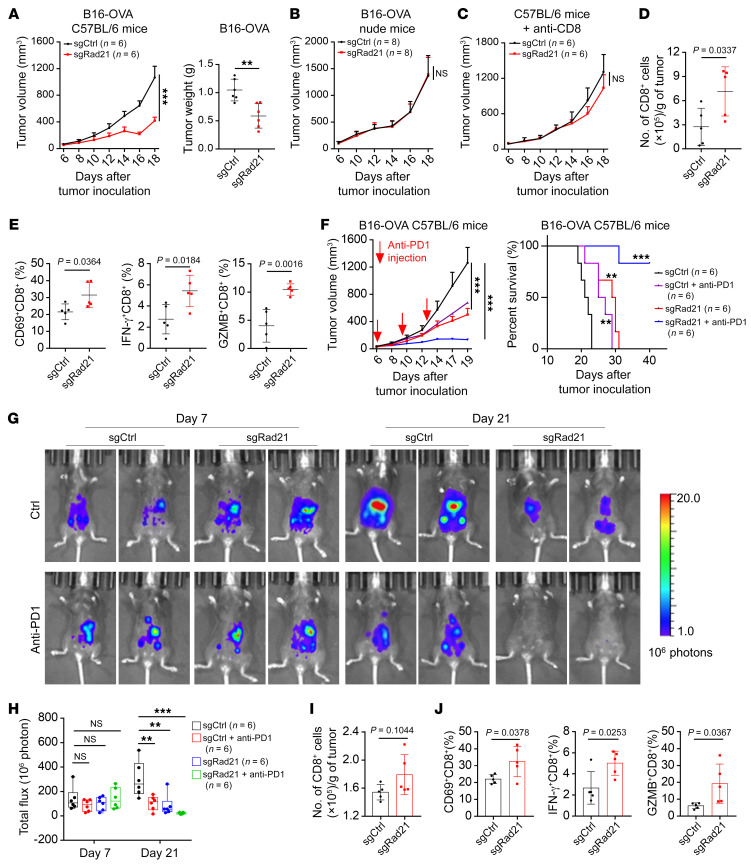
Figure 6. RAD21 suppresses antitumor immunity in vivo.
(A) Tumor volume and tumor weight over time in C57BL/6 mice implanted with Rad21-KO and control B16-OVA mouse cells. Data are shown as mean ± SEM (2-way ANOVA) for tumor volume and as mean ± SD (2-tailed t test) for tumor weight (n = 6 mice per group). (B and C) Tumor volume in nude mice (n = 8 mice per group) (B) and C57BL/6 mice (n = 6 mice per group) (C) implanted with Rad21-KO and control B16-OVA mouse cells. Mice were pretreated with CD8-depleting antibodies at –1, 2, and 5 days. Data are shown as mean ± SEM (2-way ANOVA). (D and E) Flow cytometry analysis showing the numbers of tumor-infiltrating CD8+ T cells (D) and expression of activation marker CD69 and effector molecules IFN-γ and GZMB (E) in CD8+ T cells. Data are shown as mean ± SD (n = 5, 2-tailed t test). (F) Mice with established Rad21-KO and control B16-OVA tumors were treated with anti–PD-1 at indicated time points. Tumor volume and survival rates are shown. Data are shown as mean ± SEM (2-way ANOVA). (G) Representative bioluminescence images of mice with established Rad21-KO and control ID8 tumors treated with anti–PD-1 formed by intraperitoneal injection at day 9 and day 12. (H) The bar graph shows the change in bioluminescence in mice. Data are shown as mean ± SEM (1-way ANOVA). (I and J) Flow cytometry analysis showing the numbers of tumor-infiltrating CD8+ T cells (I) and expression of CD69 and effector molecules IFN-γ and GZMB (J). Data are shown as mean ± SD (2-tailed t test). **P < 0.01; ***P < 0.001.

