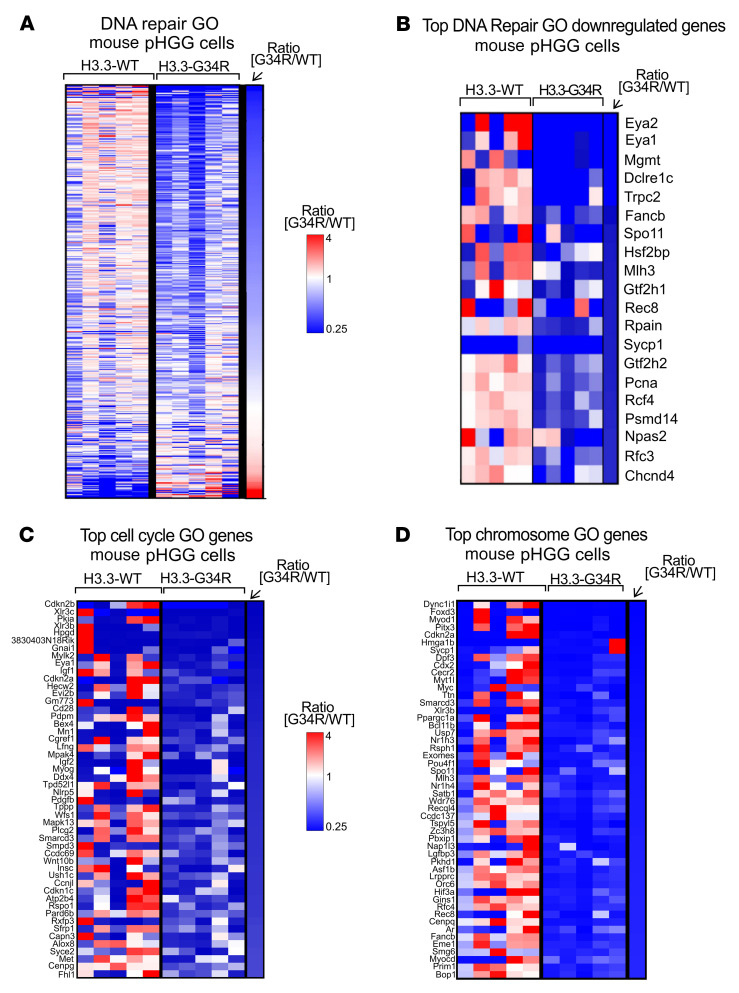
Figure 2. Transcriptomic analysis of relevant pathways in G34R mouse pHGG.
(A) Heatmap depicting the expression levels of each gene within the “DNA repair” GO, comparing H3.3-G34R with H3.3-WT mouse pHGG cells. (B) Heatmap highlighting the top DNA repair genes that were more downregulated in H3.3-G34R than in H3.3-WT mouse pHGG cells. (C and D) Heatmaps highlighting the top genes that were more downregulated for “cell cycle” (C) and “chromosome” GOs (D) in H3.3-G34R versus H3.3-WT mouse pHGG cells.

