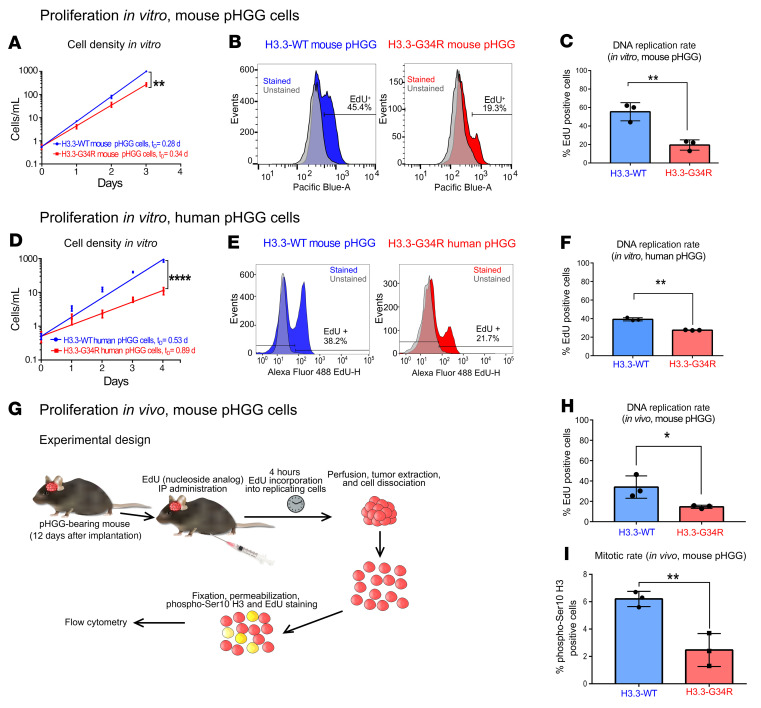
Figure 5. Analysis of proliferation of H3.3-G34R pHGG in vitro and in vivo.
(A) In vitro cell growth curve comparing mouse H3.3-G34R and H3.3-WT pHGG cells. tD, cell doubling time, in days. (B) Analysis of the fraction of replicating cells by cytometry-based quantification of EdU incorporation comparing mouse H3.3-G34R and H3.3-WT pHGG cells. (C) Statistical analysis of the fraction of replicating cells from B. (D) In vitro cell growth curve comparing human H3.3-G34R and H3.3-WT pHGG cells. (E) Analysis of the fraction of replicating cells by cytometry-based quantification of EdU incorporation, comparing human H3.3-G34R and H3.3-WT pHGG cells. (F) Statistical analysis of the fraction of replicating cells from E. (G) Scheme depicting the experimental strategy to analyze the fraction of replicating cells and mitotic rates in H3.3-G34R and H3.3-WT mouse pHGG cells in vivo. (H) Statistical analysis of the fraction of replicating cells from the experiment illustrated in G. (I) Statistical analysis of the fraction pHGG cells undergoing mitosis (stained with H3 phospho-Ser10 in cells from the experiment illustrated in G); *P < 0.05, **P < 0.01, and ****P < 0.001; analysis of the slope difference in the nonlinear regression model (A and D); unpaired t test (C, F, H, and I). Data represent the mean ± SD of 3 identical experimental.

