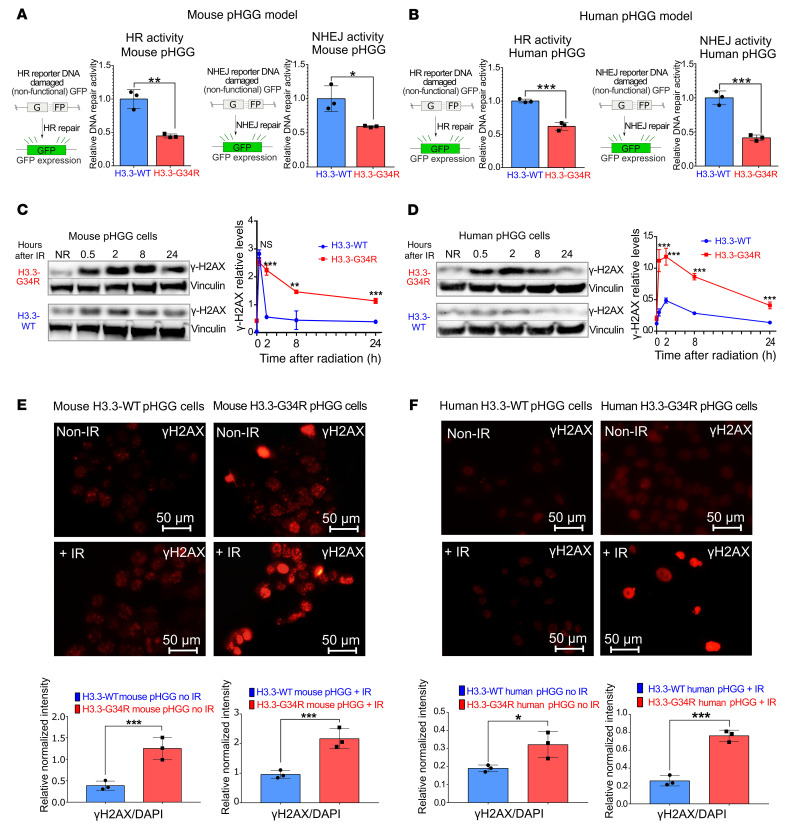
Figure 6. DNA repair activity is diminished in mouse G34R pHGG cells.
(A and B) Schemes on the left in A and B show plasmid-based reporter assays to assess HR DNA repair activity levels. The HR plasmid was linearized to disrupt the Gfp gene, and the repair of the plasmid through HR reconstituted GFP expression. Graphs on the left show in A and B HR DNA repair levels in H3.3-G34R and H3.3-WT mouse (A) and human (B) pHGG cells. Schemes on the right in A and B show plasmid-based reporter assays to assess NHEJ DNA repair activity levels. The NHEJ plasmid was linearized to disrupt the Gfp gene, and the repair of the plasmid through NHEJ reconstituted GFP expression. Graphs on the right in A and B show NHEJ DNA repair levels on H3.3-G34R and H3.3-WT mouse (A) and human (B) pHGG cells. (C and D) Western blotting for γH2AX levels of H3.3-G34R and H3.3-WT mouse (C) and human (D) pHGG cells at different time points after 3 Gy IR. Graphs on the right show quantification of γH2AX levels from the experiment described. (E and F) Immunofluorescence images of γH2AX levels in H3.3-G34R and H3.3-WT mouse (E) and human (F) pHGG cells processed 4 hours after 3 Gy IR. Scale bars: 50 μm. Graphs on the bottom show quantification of γH2AX levels determined by immunofluorescence. *P < 0.05, **P < 0.01, and ***P < 0.005; unpaired t test (A–F). Data represent the mean ± SD of 3 technical replicates.

