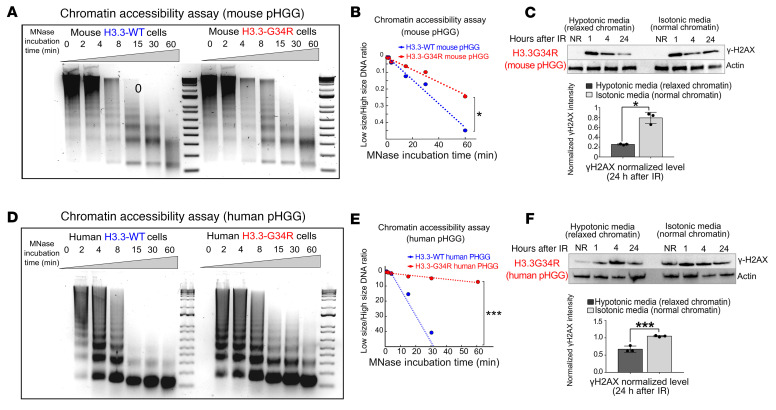
Figure 7. Chromatin accessibility is reduced in G34R pHGG.
(A) DNA gel depicting chromatin accessibility analyzed by timed MNase digestion of chromatin from H3.3-G34R and H3.3-WT mouse pHGG cells. (B) Statistical analysis of MNase digestion from A. (C) Western blot depicting γH2AX levels in response to IR under normal conditions (isotonic media) or under conditions that favored chromatin relaxation in H3.3-G34R and H3.3-WT mouse pHGG cells. Graph shows statistical analysis of γH2AX levels 24 hours after IR. (D) Chromatin accessibility analyzed by timed MNase digestion of chromatin from H3.3-G34R and H3.3-WT human pHGG cells. (E) Statistical analysis of MNase digestion of chromatin from D. (F) Western blot depicting γH2AX levels in response to IR under normal conditions (isotonic media) or under conditions that favored chromatin relaxation in H3.3-G34R and H3.3-WT human pHGG cells. Graph below shows statistical analysis of the γH2AX levels 24 hours after IR. *P < 0.05 and ***P < 0.005; unpaired t test (C and F); analysis of the slope difference in the nonlinear regression model (B and E). Data represent the mean ± SD of 3 technical replicates (C and F).

