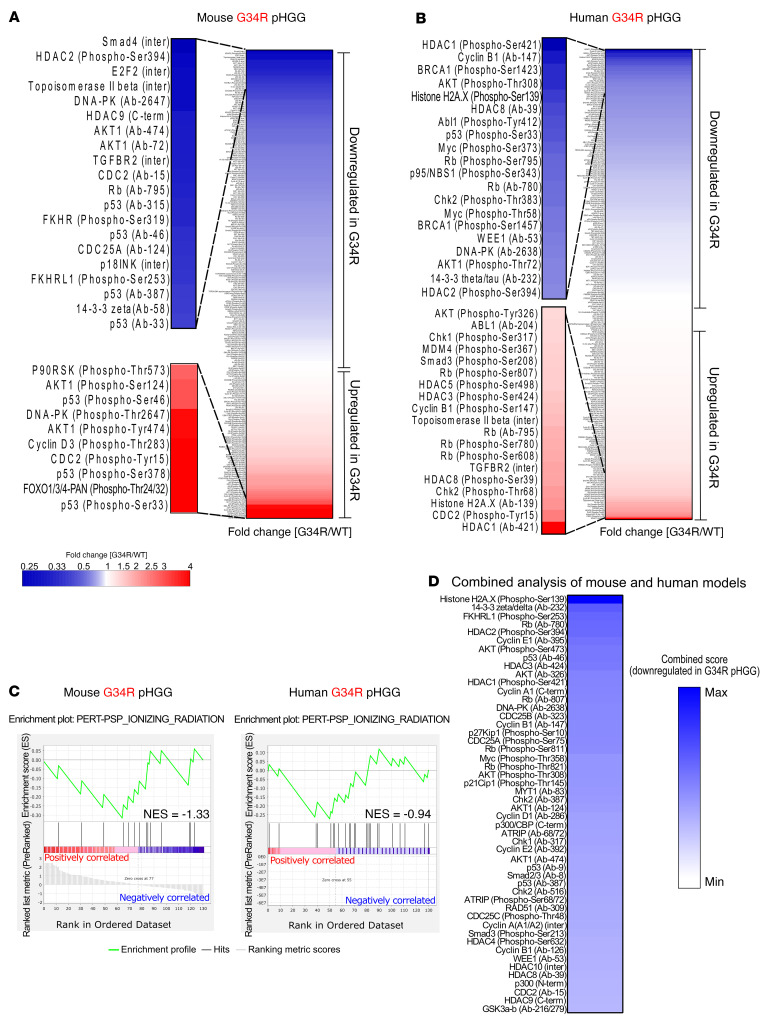
Figure 8. Analysis of DNA repair pathway activity according to protein and PTM levels in G34R pHGG cells.
(A) Heatmap showing the results of total DNA repair proteins and PTM levels in G34R mouse pHGG cells versus H3.3-WT cells, highlighting the main upregulated and downregulated proteins and PTMs. (B) Heatmap showing the results of total DNA repair proteins and PTM levels in G34R human pHGG cells versus WT cells, highlighting the main upregulated and downregulated proteins and PTMs. (C) Result of GSEA using the PTM signature PSP_IONIZING_RADIATION (a signature composed of PTMs induced by irradiation of cells). (D) Heatmap of a combined analysis highlighting the marks that were most downregulated in G34R pHGG cells in both the mouse and human models.

