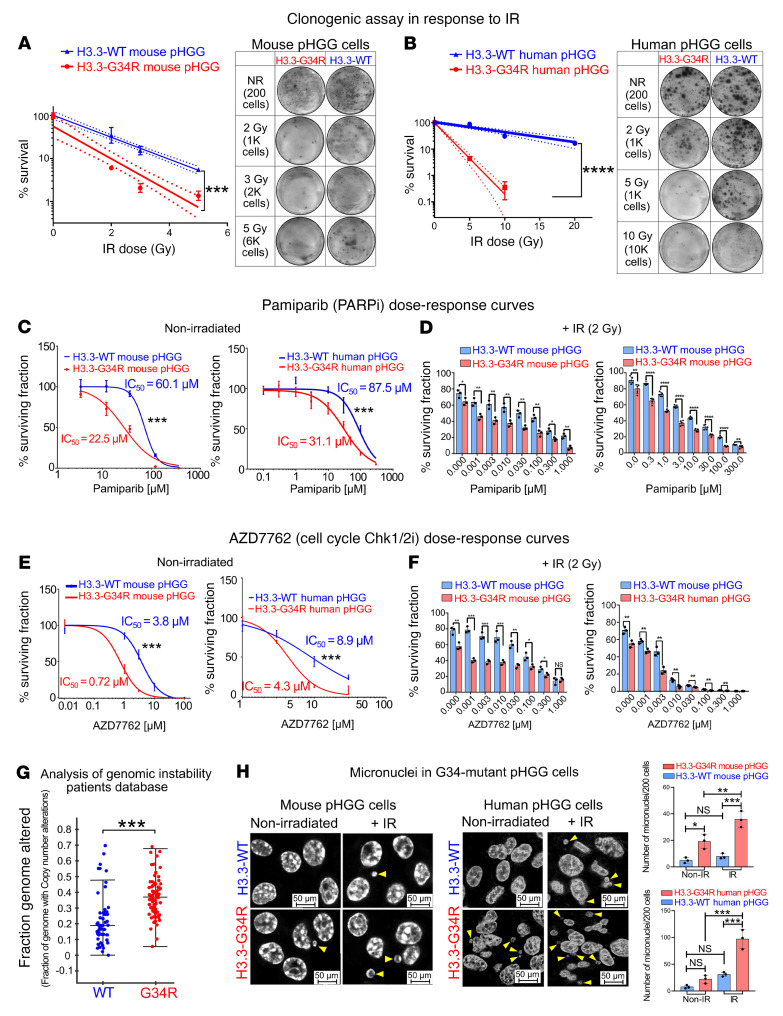
Figure 9. H3.3-G34R pHGG cells exhibit increased susceptibility to IR and to DDRi in vitro.
Clonogenic assay in H3.3-G34R and H3.3-WT mouse (A) and human (B) pHGG cells in response to increasing doses of IR. NR, no radiation. (C) Dose-response curves of H3.3-G34R and H3.3-WT mouse and human pHGG cells in response to the PARPi pamiparib. (D) Survival of H3.3-G34R and H3.3-WT mouse and human pHGG cells in response to the combination of IR and increasing doses of pamiparib. (E) Dose-response curves of H3.3-G34R and H3.3-WT mouse and human pHGG cells in response to the CHK1/2i AZD7762. (F) Survival of H3.3-G34R and H3.3-WT mouse and human pHGG cells in response to the combination of IR and increasing doses of AZD7762. (G) Analysis of the CNAs of genomes of patients carrying H3.3-WT or H3.3-G34R pHGG, from the PedcBioPortal database. (H) Analysis of the number of micronuclei in H3.3-G34R and H3.3-WT mouse and human pHGG cells under basal conditions and after IR. Yellow arrowheads indicate micronuclei. Scale bars: 50 μm. *P < 0.05, **P < 0.01, ***P < 0.005, and ****P < 0.001; analysis of the slope difference in the nonlinear regression model (A and B); the survival fraction for each irradiation dose was calculated for each irradiated plate as follows: (colonies on nontreated plate)/(cells plated on nontreated plate)/(colonies on case plate)/(cells plated on case plate); analysis of the IC50 difference in the sigmoid nonlinear regression model (C and E); unpaired t test (D and F), Wilcoxon test (G), and 1-way ANOVA with Šidák’s multiple-comparison correction (H). Data represent the mean ± SD of 3 identical experiments (A–F).

