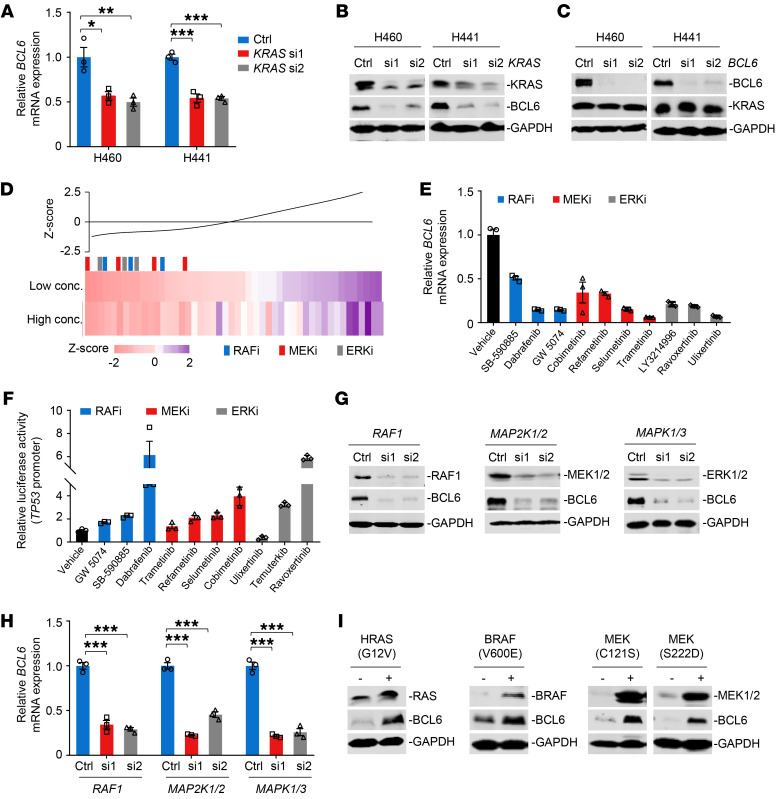
Figure 2. The MAPK/ERK signaling axis contributes to BCL6 expression.
(A and B) KRAS knockdown downregulated BCL6 mRNA (A) and protein (B) expression. Cells were transfected with 20 nM siRNAs targeting KRAS for 48 hours. (C) BCL6 silencing did not affect KRAS expression. (D) The MAPK/ERK pathway inhibitors suppressed BCL6 expression. H460 cells were treated with a small-molecule library consisting of 48 compounds at their respective IC50s (Low conc.) or double IC50s (High conc.) for 48 hours. BCL6 levels detected by immunoblotting analysis in compound-treated cells were normalized to those in DMSO-treated cells. The readout of each compound was analyzed into a z score as a line graph and as a gradient colored bar. Colored vertical bars indicate the inhibitor class, and the black bar indicates the mean. (E) The MAPK/ERK pathway inhibitors downregulated BCL6 mRNA expression. H460 cells were treated with the indicated inhibitors at a concentration of their respective IC50s for 48 hours. (F) The MAPK/ERK pathway inhibitors increased the TP53-pGL3 reporter activity. H460 cells were transiently transfected with the TP53-pGL3 reporter plasmid before treatment. The readout of luciferase values in treated groups was normalized to that in the DMSO-only group. (G and H) Knockdown of RAF1, MAP2K1/2, and MAPK1/3 inhibited BCL6 protein (G) and mRNA (H) expression levels in H460 cells. (I) Constitutively active variants upregulated BCL6 expression in 293T cells. Data in A, E, F, and H are expressed as mean ± SEM of 3 technical replicates, representative of 3 independent experiments with similar results. Statistical analyses in A and H were performed using 1-way ANOVA with Tukey’s multiple comparison test, *P < 0.05, **P < 0.01, ***P < 0.001. The immunoblots in B, C, G, and I were contemporaneous and run in parallel from the same biological replicate, representative of 3 independent experiments.

