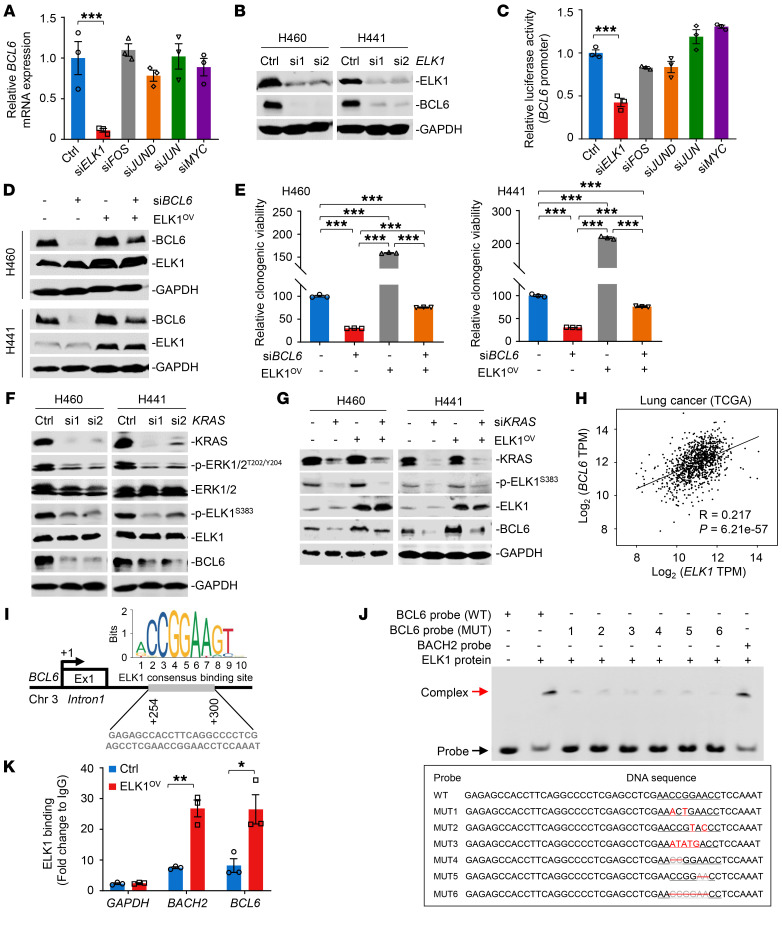
Figure 3. ELK1 directly binds to BCL6 promoter and promotes its expression.
(A) ELK1 knockdown decreased BCL6 mRNA expression levels in H460 cells. (B) ELK1 knockdown decreased BCL6 protein levels. (C) ELK1 silencing suppressed BCL6 promoter activity. H460 cells were cotransfected with BCL6-pGL3 and indicated siRNAs for 48 hours. (D) Exogenous transduction of ELK1 (ELK1OV) in BCL6-depleted cells restored BCL6 expression. (E) Ectopically expressed ELK1 increased the clonogenic growth of BCL6-depleted cells. The relative clonogenic viability was calculated by setting the untreated group as 100%. (F) KRAS knockdown reduced pERK1/2T202/Y204, pELK1S383, and BCL6 levels. (G) Exogenous transduction of ELK1 (ELK1OV) in KRAS-depleted cells restored BCL6 expression. (H) Scatterplot showing a positive correlation of BCL6 mRNA expression levels with ELK1 mRNA expression levels in human lung cancer data sets derived from the TCGA. n = 1145. R, Pearson’s correlation coefficient. (I) Human BCL6 locus containing ELK1 consensus binding site (Jaspar prediction) in exon1A region. The transcription start site is indicted as +1. Exon 1, Ex1. (J) Electrophoretic mobility shift assay showing the binding complex of ELK1 protein and indicated probes, as indicated by red and black arrows, respectively (top). The sequence of BCL6 mutant probes (MUT1–MUT6) are shown (bottom). The mutated bases are indicted in red, and base depletion are indicated in gray with a red line-through. (K) ChIP-qPCR data showing enrichment of ELK1 binding to the BCL6 promoter. The fold change of ELK1 binding is shown. Data in A, C, E, and K are expressed as mean ± SEM of 3 technical replicates. Statistical analyses in A, C, and E were performed using 1-way ANOVA with Tukey’s multiple comparison test, and in K using unpaired 2-tailed Student’s t test, *P < 0.05, **P < 0.01, ***P < 0.001. The immunoblots in B, D, F, and G were contemporaneous and run in parallel from the same biological replicate.

