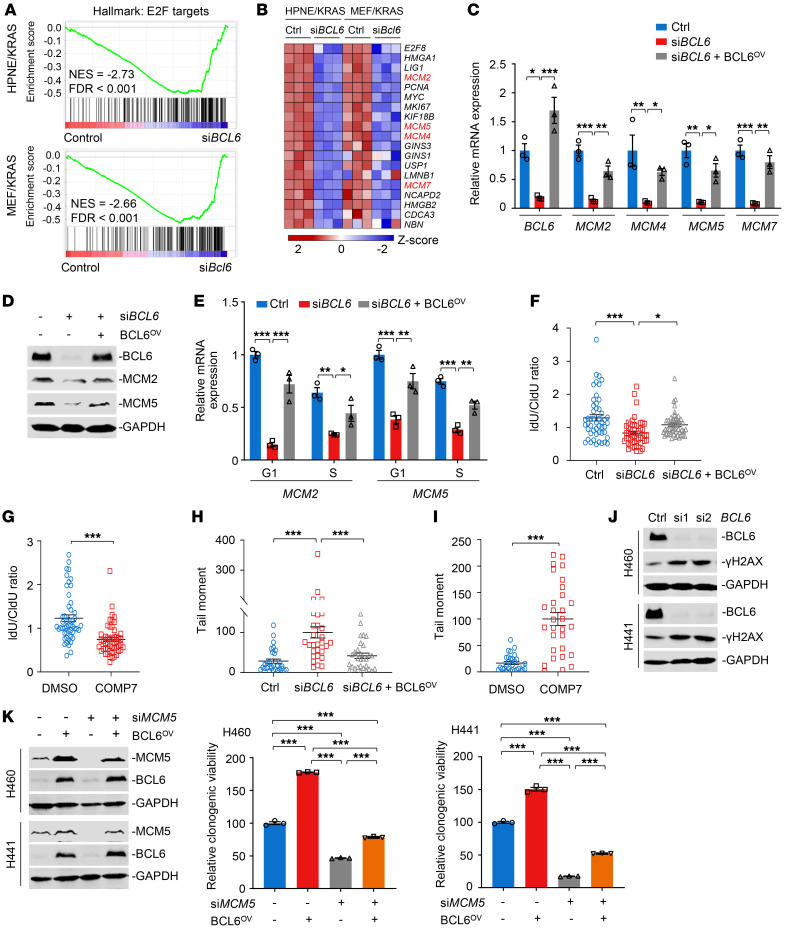
Figure 5. BCL6 inhibition results in replication fork stalling and DNA damage.
(A) Gene set enrichment analysis of E2F targets in HPNE/KRAS (top) and MEF/KRAS cells (bottom). n = 3; NES, normalized enrichment score. (B) Heatmap showing E2F target gene expression in HPNE/KRAS and MEF/KRAS cells after BCL6 knockdown. z score was calculated based on counts of exon model per million mapped reads. n = 3. (C and D) Exogenous transduction of BCL6 (BCL6OV) restored expression of preRC genes in BCL6-depleted cells. H460 cells were transfected with BCL6 siRNAs alone or in combination with pcDNA 3.1-BCL6 vector. (E) MCM2 and MCM5 mRNA expression of sorted H460 cells. (F and G) DNA fiber analysis (n = 50 fibers). H460 cells were treated with genetic (F) or pharmacological approaches (10 μM COMP7) (G) Idu/CIdU ratio indicates red to green ratio. (H and I) Alkaline comet assays in H460 cells. The tail moment was defined as percentage of tail DNA × tail length using the Casp software. n = 30 cells. (J) BCL6 knockdown increased γ-H2AX expression. (K) BCL6 overexpression reduced MCM5 knockdown–mediated cytotoxicity. BCL6 and MCM5 expression (left) and the relative viability of cultured colonies (right) are shown. Data in C, E, F, G, H, I, and K were expressed as mean ± SEM Statistical analyses in C, E, F, H, and K were performed using 1-way ANOVA with Tukey’s multiple comparison test, and in G and I using unpaired 2-tailed Student’s t test, *P < 0.05, **P < 0.01, ***P < 0.001. The immunoblots in D, J, and K were contemporaneous and run in parallel from the same biological replicate, representative of at least 3 independent experiments.

