
Extended Data Fig. 1 |. Gene ontology (GO) analysis of genes differentially expressed in bsu-q.
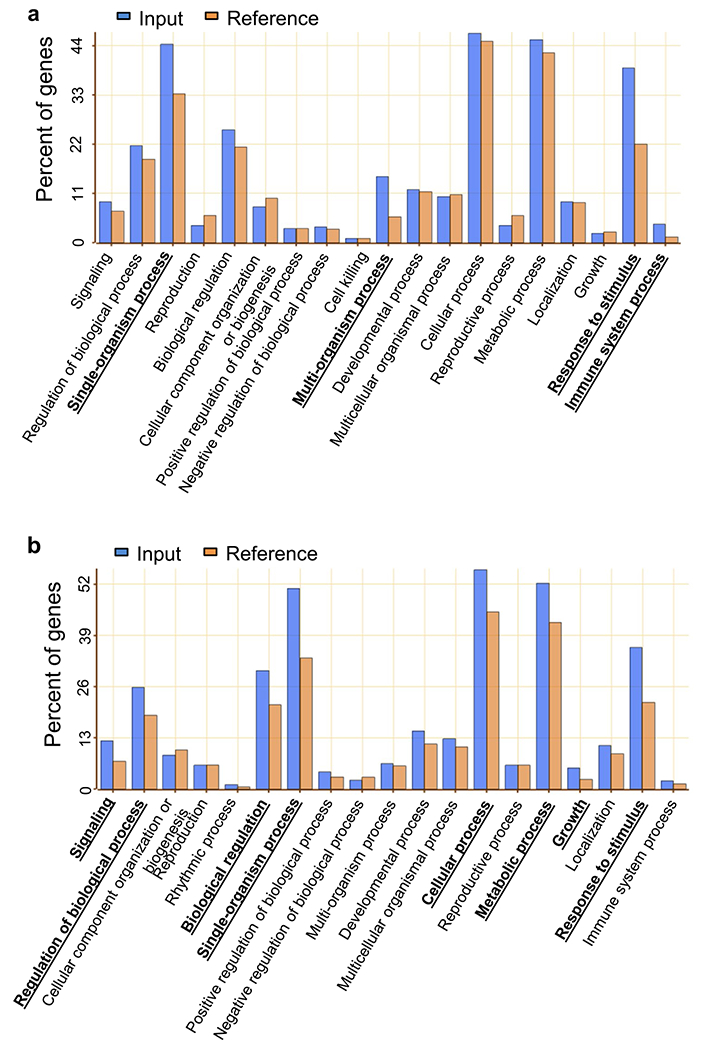
(a, b) Enrichment of GO annotation in categories of biological process for genes increased (a) and decreased (b) in bsu-q. Blue and orange columns indicate the percent of genes of input (Supplementary Table 2) and reference (TAIR10), respectively. Bold with underlines indicate enriched GO categories of biological process.