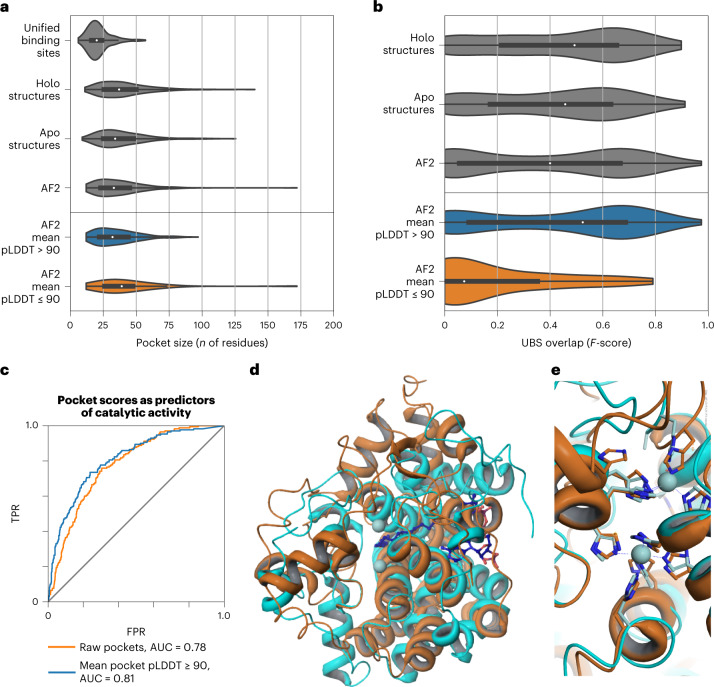
Fig. 4. Pocket detection and function prediction.
a, Size of known binding sites (or unified binding sites) compared with the size of top AutoSite pockets in experimental holo (bound), experimental apo (unbound) and AF2 structures. AF2 structures are split into high-confidence (mean pLDDT > 90) and low-confidence (mean pLDDT ≤ 90) subsets. The bottom, middle line and top of the box correspond to the 25th, 50th and 75th percentiles, respectively. The lines extend to 1.5 × IQR. b, Distribution of overlap between known binding sites and top predicted pockets for holo, apo and AF2 structures. The bottom, middle line and top of the box correspond to the 25th, 50th and 75th percentiles, respectively. The lines extend to 1.5 × IQR (interquartile range). c, Enzymatic activity prediction using pocket-derived, template-derived and combined metrics. AUC, area under the curve. TPR, true positive rate; FPR, false positive rate. d, Superposition of the AF2 model of DEGS1 (O15121) with PDB entry 4ZYO. Orange: ribbon representation of AF2 predicted structure for DEGS1. Cyan: ribbon representation of 4ZYO. Zinc atoms (light blue spheres) and bound substrate (dark blue ball and stick) as observed in the structure of 4ZYO are also shown. e, Close up of the metal-binding center of 4ZYO. Ribbon representation of the protein and metal chelators for DEGS1 and 4ZYO are shown in orange and cyan, respectively. The zinc atoms observed in 4ZYO are shown as light blue spheres. Metal-chelating residues for DEGS1 are clearly identifiable.

