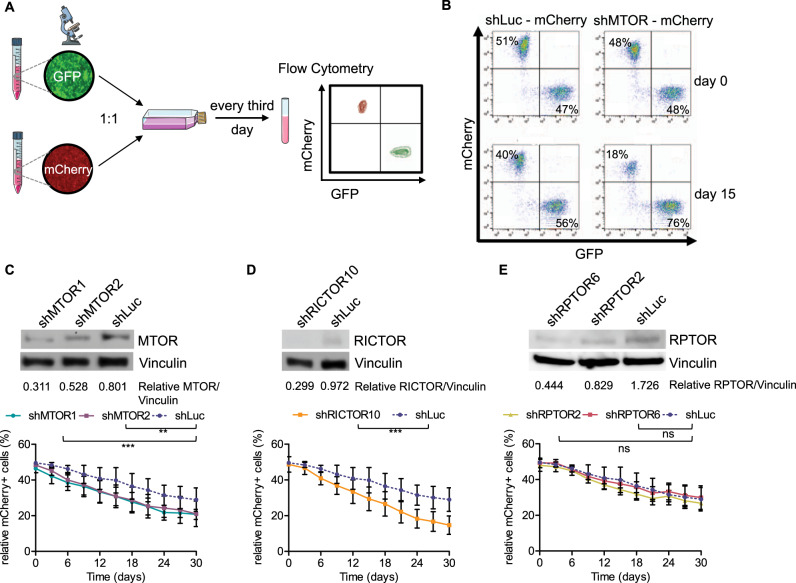
Fig. 2. Depletion of MTOR or RICTOR decreases proliferation of human ALL cells.
A Scheme of proliferation competition assay. Parts of the image are taken from https://smart.servier.com. B Dot plot proportion of mCherry+ and GFP+ cells in flow cytometry at day 0 and after 15 days of culture of a representative experiment, in which RCH-ACV cells were transduced with control shRNA (shLuc, Luciferase) or shRNA for MTOR (shMTOR) with a mCherry as fluorescence marker. RCH-ACV cells transduced with control shRNA (shLuc) with a GFP marker were used as control cells in the competition assay and mixed 1:1 at day 0. C–E Western blot analysis (representative of three independent experiments) at the top of the panel show protein levels following knockdown by different shRNA constructs in RCH-ACV cells. Vinculin was used as loading control. Densitometry values were calculated using ImageJ software. Diagrams at the bottom show percentage of mCherry+ cells transduced with shRNAs for luciferase (control) or different shRNA constructs of (C) MTOR, (D) RICTOR or (E) RPTOR for 30 days. Data represent the mean ± SEM of three independent experiments. Statistical analysis performed using non-linear regression analysis and curves were compared with the sum-of-squares F test. ns not significant, **p < 0.01, ***p < 0.001.

