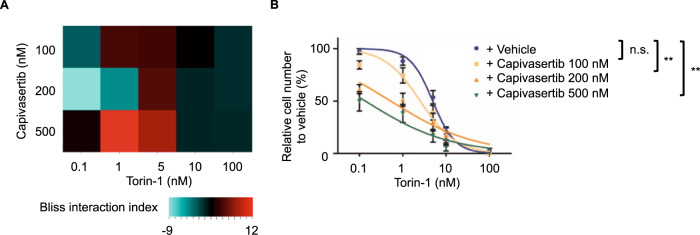
Fig. 4. Synergistic effect of the MTOR inhibitor torin-1 and the AKT inhibitor capivasertib.
A Heatmap representation of Bliss interaction index for RCH-ACV cells treated with the MTOR inhibitor torin-1 and the AKT inhibitor capivasertib. Data represent the mean of three independent experiments. B Titration curve for RCH-ACV cells treated with torin-1 in combination with vehicle or capivasertib. Data represent mean ± SEM of three independent experiments. P values were calculated using non-linear regression analysis and curves were compared with the sum-of-squares F test. ns not significant, **p < 0.01.

