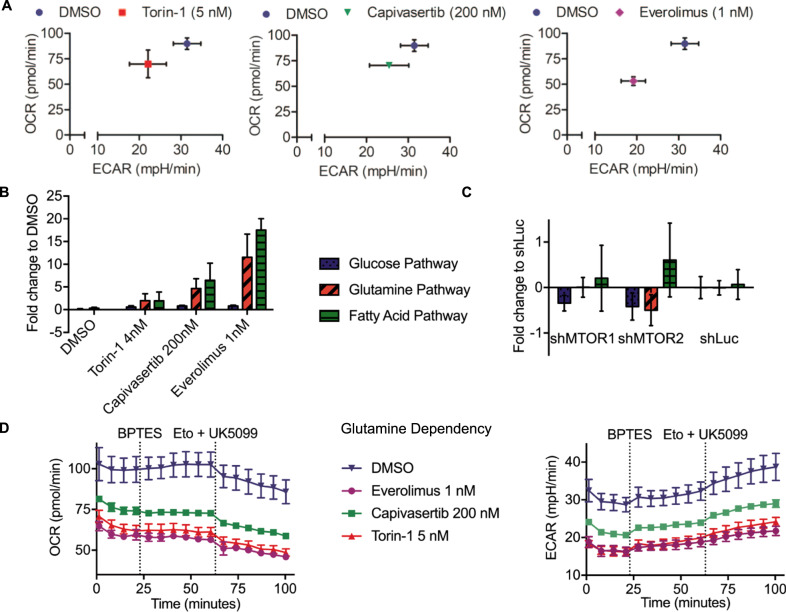
Fig. 6. Effects of MTOR and AKT pharmacological inhibition and shRNA-mediated knockdown of MTOR on cell metabolism.
RCH-ACV bioenergetics studies were performed in supplemented medium. OCR kinetic reads were taken in 6 min intervals with the first injection after four reads for basal OCR, followed by six reads per inhibitor treatment. A Basal OCR and ECAR of RCH-ACV cells after 24 h pretreatment with torin-1, capivasertib or everolimus compared to cells treated with the vehicle. B Fold change in dependency on glucose, fatty acids and glutamine for mitochondrial respiration of cells pretreated for 24 h with the indicated inhibitor to DMSO treated cells. Statistical analysis by Student t test assuming a normal distribution. C Fold change of shMTOR knockdown cells to shLuc control cells in dependency on glucose, fatty acids and glutamine for mitochondrial fuel oxidation. Dependency was calculated from the difference in basal OCR and OCR after blocking the individual pathway divided by basal OCR less OCR after all inhibitors with sequential injections of 2 mM UK5099, 4 mM etomoxir and 3 mM BPTES, respectively. Data represent mean ± SEM of three independent experiments. D OCR (left panel) and ECAR (right panel) plots during the Mito Fuel Flex Test to determine glutamine dependency of RCH-ACV cells pretreated with the indicated substances for 24 h. Dashed lines indicate injection timepoints of the labeled inhibitors. Mean ± SD of one representative experiment with four technical replicates is shown. OCR Oxygen Consumption Rate, ECAR Extracellular Acidification Rate, Eto Etomoxir.

