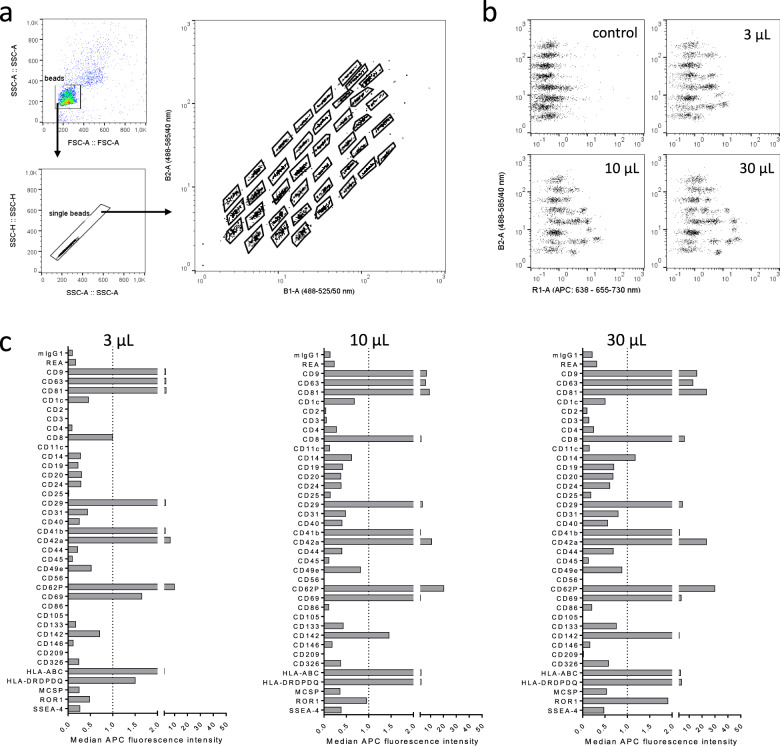
Fig. 2. Establishment of a robust workflow to directly quantify EV surface protein expression in serumsamples by MBFCM.
a Gating strategy applied to identify capture bead populations. b Examples for signals detected when using different seruminput volumes for the MBFCM assay. Control indicates procedural control without EVs but stained with pan-tetraspanin detection antibodies, volumes given indicate seruminput volumes. Allsamples were diluted in MACSPlex buffer to a final volume of 60 µL during the initial capture step. c Example data showing detected background-subtracted signal intensities for each marker at different seruminput volumes.

