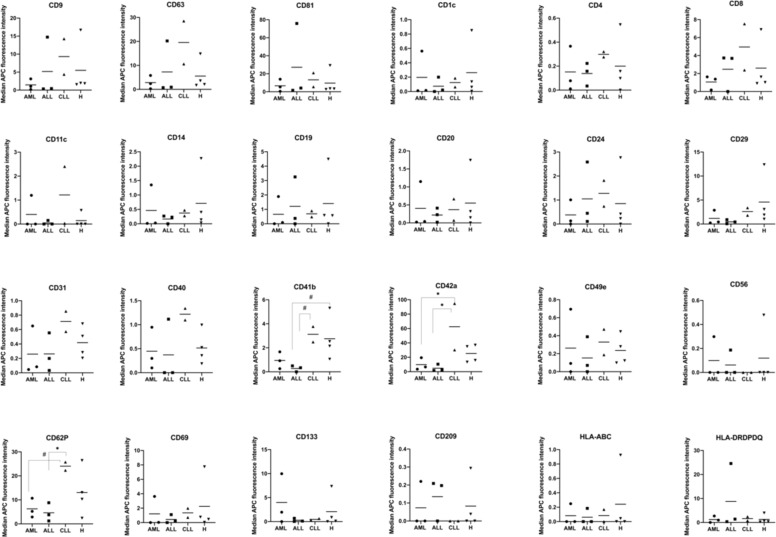
Fig. 4. Quantification and comparison of EV surface marker expression in leukemic and healthy serum samples with MBFCM.
Serum samples were analyzed by MBFCM. Differences in marker expressions on serum-derived EVs from AML (n = 3), ALL (n = 3), CLL (n = 2) and Healthy samples (n = 4) are shown in mean values. For statistical comparison of more than two groups one-way analysis of variance (ANOVA) with Benjamini-Hochberg adjustments for multiple comparisons was applied. Differences were considered as ‘borderline significant’ (#) with p-values between 0.05 and 0.1 and as ‘significant’ (*) with p-values between 0.01 and 0.05.

