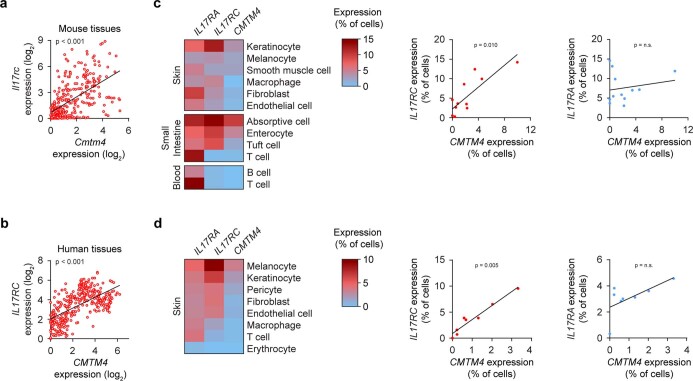
Extended Data Fig. 6. CMTM4 and IL-17RC share similar expression patterns.
a, b, Relative expression of Cmtm4 and Il17rc in mouse tissues (a) or relative expression of CMTM4 and IL17RC in human tissues (b) was analyzed using the Genevestigator software. Each dot represents the log2 of the average expression for different tissues or cell types of the Genevestigator mRNA-Seq Gene Level data. Spearman’s correlation test. c, d, Expression of IL17RA, IL17RC, and CMTM4 was analyzed in single-cell RNAseq datasets of human tissues available at the Gene Expression Omnibus. The percentage of cells with at least one detected transcript of IL17RA, IL17RC, or CMTM4 in each cell type was visualized in a heatmap (left) or a scatterplot (right). Spearman’s correlation test. Dataset GEO accession numbers are GSE159929 (c) or GSE130973 (d).

