Fig. 2.
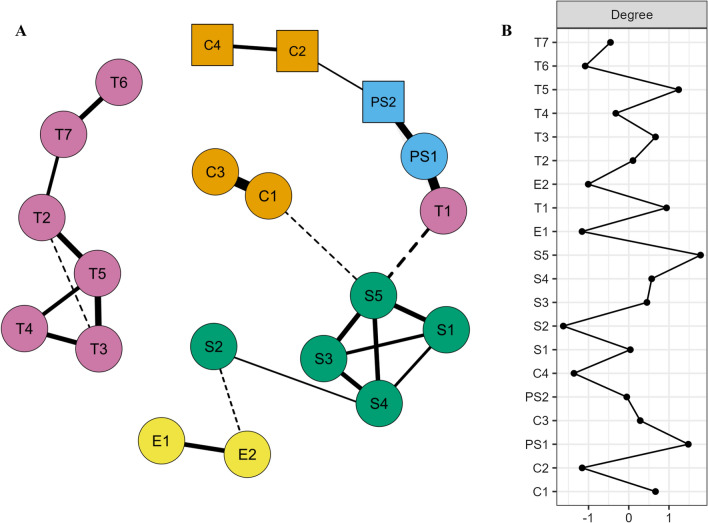
Network analysis plot (panel A) including z-standardized node centrality profile (panel B). N = 415 due to missing data. Quadratic nodes represent categorical variables. Edge thickness indicates strength of node association conditioned on all other possible associations between nodes (largest edge: C1–C3 = .56, smallest nonzero edge: S2–E2 = − .04). Negative associations are indicated by dashed lines; control variables: C1 = age, C2 = sex, C3 = general treatment experience (years), C4 = psychological vs. medical therapist; stigmatization scales: S1 = Dangerousness, S2 = Intentionality, S3 = Deviance, S4 = Punitive Attitudes, S5 = Social Distance Scale; secondary prevention expectations: E1 = success expectation, E2 = belief that more prevention is needed; specific treatment skills: PS1 = MAP treatment competence; PS2 = MAP treatment experience; treatment expectations; T1 = treatment willingness; T2 = MAP problem severity sexual and behavioral; T3 = MAP problem severity intimacy; T4 = MAP problem severity affective; T5 = MAP problem severity interpersonal; T6 = treatment barriers skills and liability; T7 = treatment barriers effort

