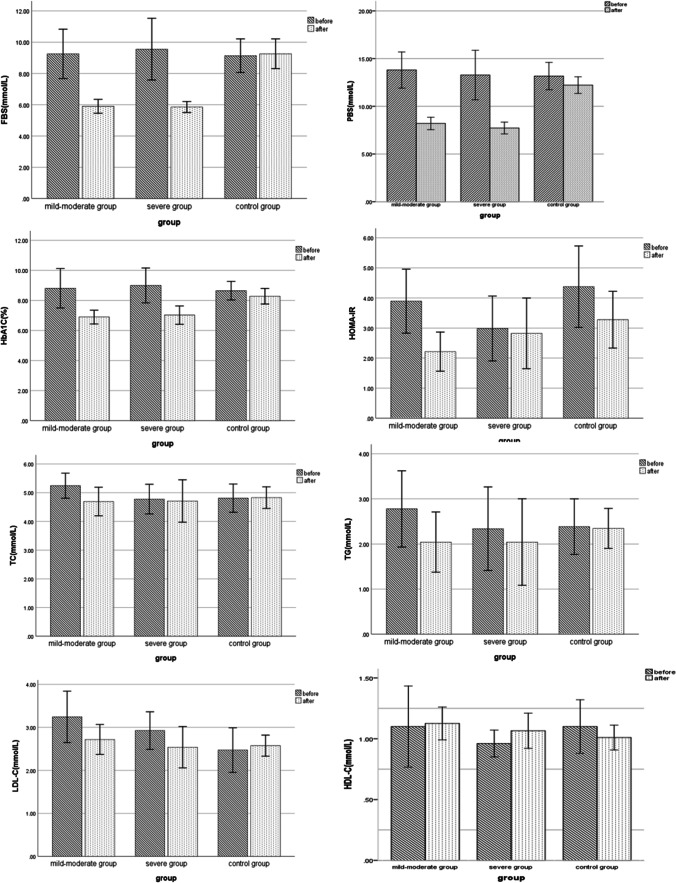
Fig. 1.
Comparison of laboratory indexes between intervention group and control group before and after treatment. There are no significant differences in LDL-C, TG, HDL-C, and TC, between the three groups. The level of HbA1c, PBG, and FBG reduced significantly compared with before in the intervention group (P < 0.05). In the control group, however, there were no significant differences in HbA1c, FBG, or PBG when compared to baseline (P > 0.05)

