. 2007 Nov 30;13(4):193–202. doi: 10.2188/jea.13.193

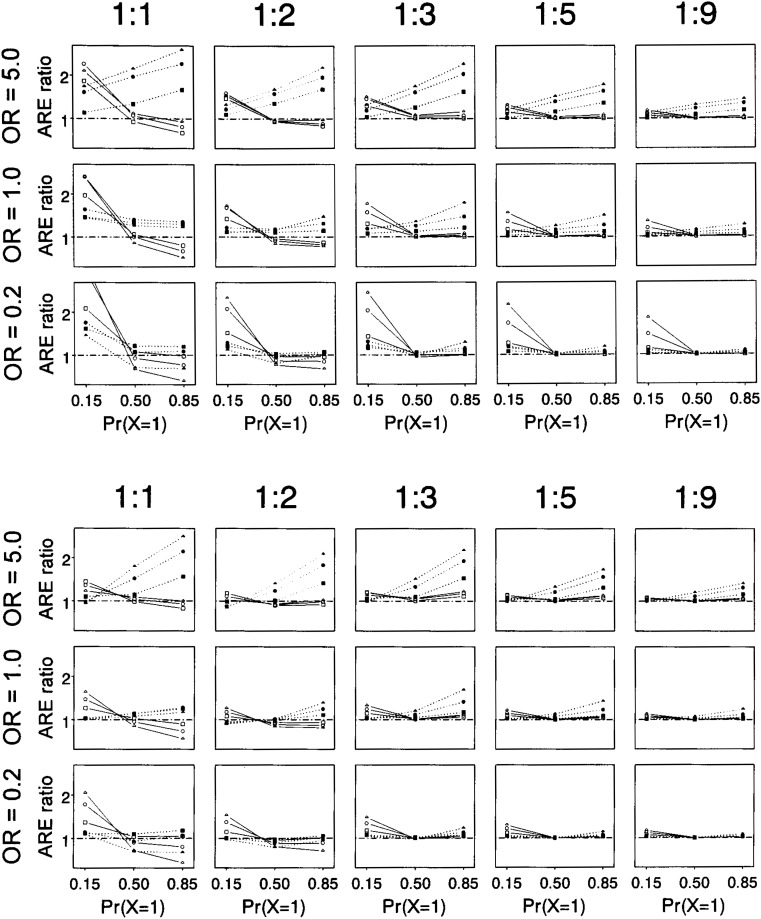
Figure 2. Results of asymptotic relative efficiency (ARE) calculations versus three levels of prevalence of exposure [Pr(X=1)].
Points are the ratio of ARE for counter matching to that for matching (▲ ● ■) or random sampling (△ ○ □). Three levels of prevalence of the other factor, Z, are compared: Pr(Z=1) = 0.1 (▲ △), Pr(Z=1) = 0.25 (● ○), and Pr(Z=1) = 0.5 (■ □). Relative efficiencies were calculated for three levels of correlation between X and Z: odds ratio (OR) = 5.0, 1.0, or 0.2. Three values of the interaction between exposure X and other factor Z were examined: exp{γ}=5.0 (upper panel), exp{γ}=0.2 (lower panel), and exp{γ}=1.0 (not shown; results were intermediate to the other two). Results are for case-control ratios of 1:1, 1:2, 1:3, 1:5, and 1:9. With two controls, the AREs of counter matching for the two allocation strategies were averaged.

Figure 2.