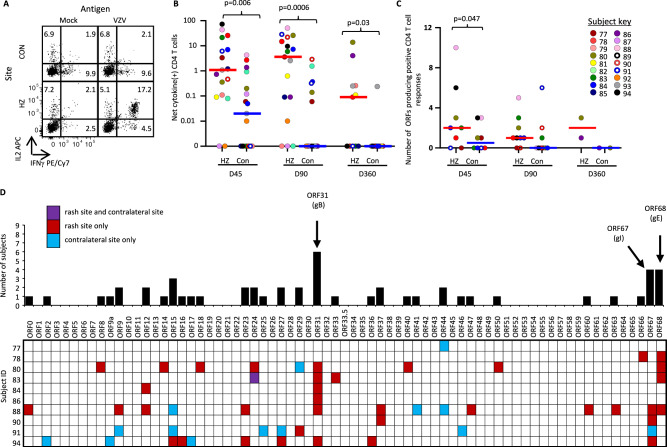
Fig. 3. VZV-specific skin-CD4 T cells.
A Example of VZV-specific CD4 T cell detection by ICS for IFN-γ and/or IL-2 in skin T cell lines (TCL) exposed to UV-inactivated VZV (UV-VZV) or mock antigen, showing VZV-specific CD4 T cells localized to HZ skin. Day 90 sample from subject 78. B Net frequency of VZV-specific CD4 T cells in HZ-TCL and CON-TCL by ICS for IFN-γ and/or IL-2 (day 45 and day 90 n = 17; day 360, n = 10). Line represents median. Unadjusted 2-sided p values from multiple Wilcoxon tests to compare HZ skin site and CON skin site data within time points are shown. C Breadth of T cell proliferative responses as measured by number of reactive VZV ORFs in skin-TCL from days 45 (n = 8), 90 (n = 9), and 360 (n = 2). Skin-TCL pairs were screened if either the HZ-TCL or CON-TCL had >3% net cytokine-positive cells in ICS assays. Responses in paired cell lines were compared using Wilcoxon’s test: Unadjusted 2-sided p values <0.05 are indicated. D Summary of the subject-level ORF specificity of proliferative T cell responses in HZ-TCL and CON-TCL from 10 subjects. Each subject studied is shown in a row; each VZV ORF occupies a column. Data are condensed with a response in one or more time point for a subject marked as positive. VZV varicella-zoster virus, ICS intracellular cytokine staining, HZ herpes zoster rash, Con contralateral, D45 day 45, D90 day 90, D360 day 360, ORF open-reading frame. Source data are provided as a Source Data file.

