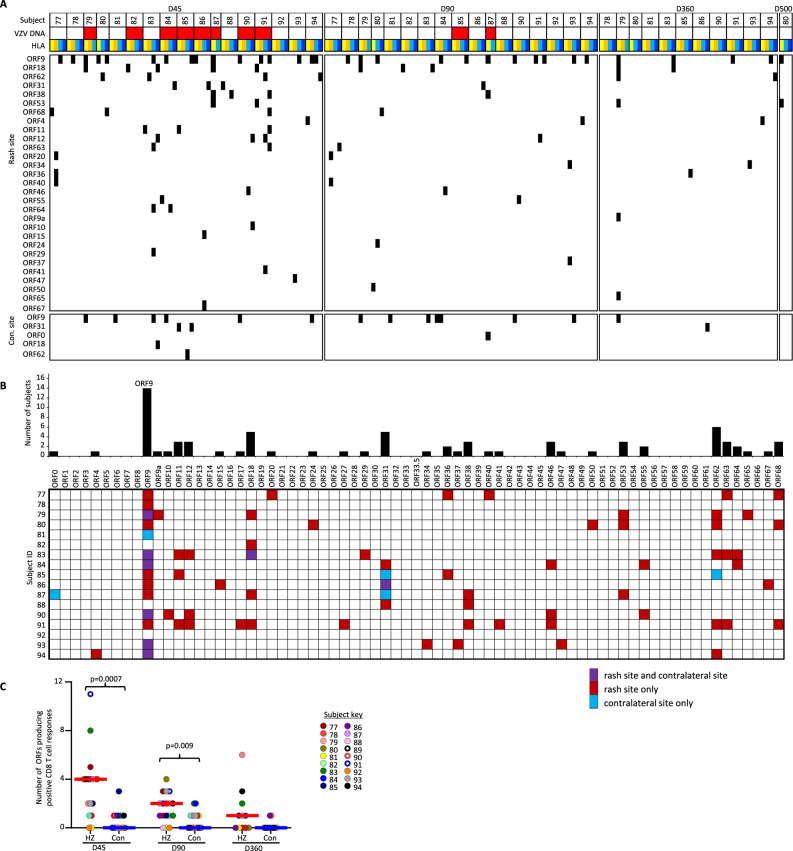
Fig. 4. VZV-specific skin CD8 T cells.
Skin-TCL containing a mixture of CD4 and CD8 T cells were generated from post-HZ and unaffected contralateral skin site as outlined in the methods. A. Heatmap showing positive CD8 T cell responses (black boxes) from each rash or contralateral biopsy to artificial antigen presenting cells co-expressing an individual subject-specific HLA class I (columns) and single VZV ORF (rows). Days after HZ rash onset are shown at the top with subject numbers underneath. Detection of VZV DNA at the time of biopsy is indicated with red. HLA-allele color codes: HLA-A in light or dark yellow, HLA-B in light or dark blue. Only VZV ORFs with at least one positive response are shown. B Summary of the per subject specificity of CD8 T cell responses to each VZV ORF in biopsies obtained from the rash and/or contralateral skin from 17 subjects. Data are condensed, such that the responses were observed at any of the tested time points and across all subject-specific HLAs. Biopsy locations are color-coded for HZ, contralateral, or both biopsies. C The number of VZV ORFs that trigger CD8 T cell responses within each skin-TCL integrated across all HLAs within each subject. Each dot represents a single biopsy. D45, n = 17 D90, n = 17, D360, n = 11. Responses in paired skin-TCL were compared using Wilcoxon’s test: Unadjusted 2-sided p values <0.05 are indicated. VZV varicella-zoster virus, HZ herpes zoster rash, Con contralateral, D45 day 45, D90 day 90, D360 day 360, D500 day 500, ORF open-reading frame, HLA human leukocyte antigen, TCL T cell line. Source data are provided as a Source Data file.

