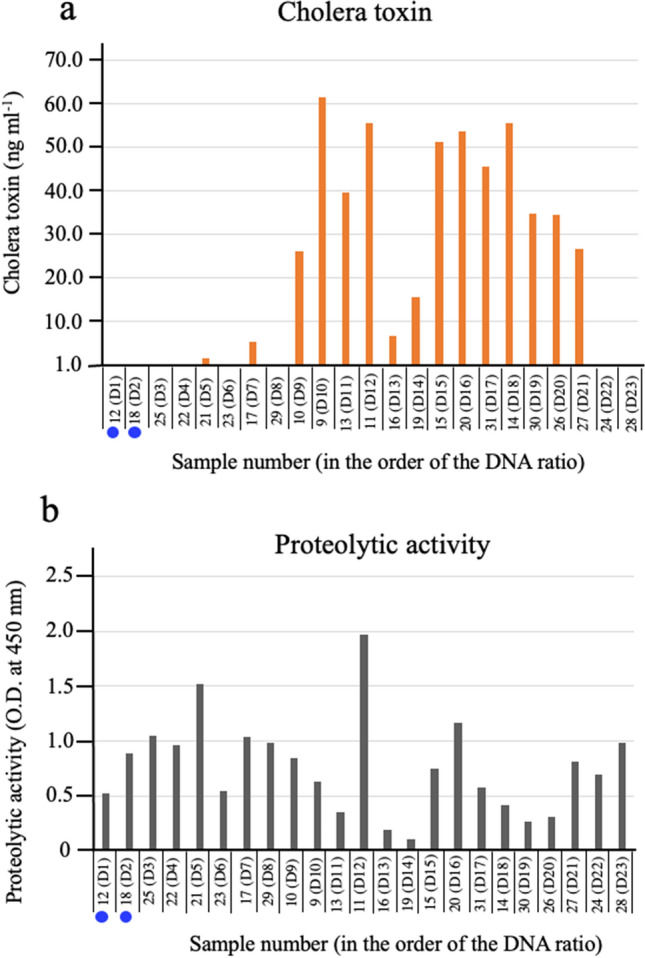
Figure 5.

The levels of CT and proteolytic activity in the stool samples. Twenty-three stool samples of patients who were diagnosed with cholera disease were centrifuged at 10,000×g for 10 min. The CT content of the supernatants was determined using a GM1-ganglioside ELISA method8 (a). The proteolytic activity of the supernatants was determined by the lysis of casein10 (b). The sample numbers are the same as the numbers shown in the footnotes of Fig. 3. Numbers beginning with D in parentheses show the order of the content of DNA from V. cholerae among these samples. The samples in this figure are arranged in the order of the D numbers. A bar indicating the amount of CT is not drawn in the figure for the sample whose CT amount was below the detection limit. From the tests shown in Figs. 2, 3 and 4, samples of two patients who are unlikely to have diarrhea caused by the infection with V. cholerae are marked with a blue circle. O.D.: optical density.
