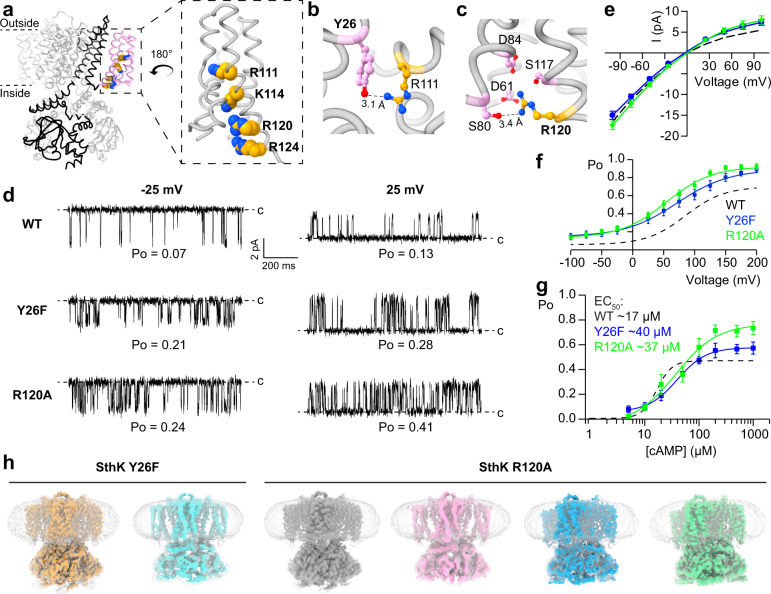
Fig. 1. Identification and characterization of gain-of-function VSD mutants.
a Structural overview of SthK (PDB: 6cju), one subunit is highlighted in black with the voltage sensing domain in pink and conserved, basic residues on the S4 helix as spheres. Inset highlights the voltage sensor with the positively charged residues indicated. b Interactions between Y26 on the S1 helix (pink) and R111 on the S4 helix (yellow). c Interaction between R120 on the S4 helix (yellow) and several surrounding residues on S2 and S3 (pink). d Single channel recordings of WT SthK, SthK Y26F, and SthK R120A at −25 mV and +25 mV in the presence of 200 µM cAMP. Closed levels are indicated by dashed lines. e Single channel current amplitude as a function of voltage (I/V) for WT SthK (dashed, from ref. 24), SthK Y26F (blue), and SthK R120A (green) in the presence of 200 µM cAMP from recordings as in (d). f Open probability in the presence of 200 µM cAMP as function of the applied voltage. Colors as in (e). Lines represent fits according to Eq. 1. g Open probability at +100 mV as function of the cAMP concentration. Colors as in (e). Lines represent fits according to Eq. 2. All fitted parameters from electrophysiological recordings are summarized in Supplementary Table 1. h Cryo-EM maps of the different channel conformations obtained for SthK Y26F and SthK R120A in lipid nanodiscs. Unsharpened maps and density for nanodiscs, are in gray/transparent. Different colors highlight the different structures. Symbols in e–g represent mean ± SEM. n = 3–20 independent experiments for all data points. Dashed lines in e–g represent WT SthK data from ref. 24. Source data are available as a Source Data file.

