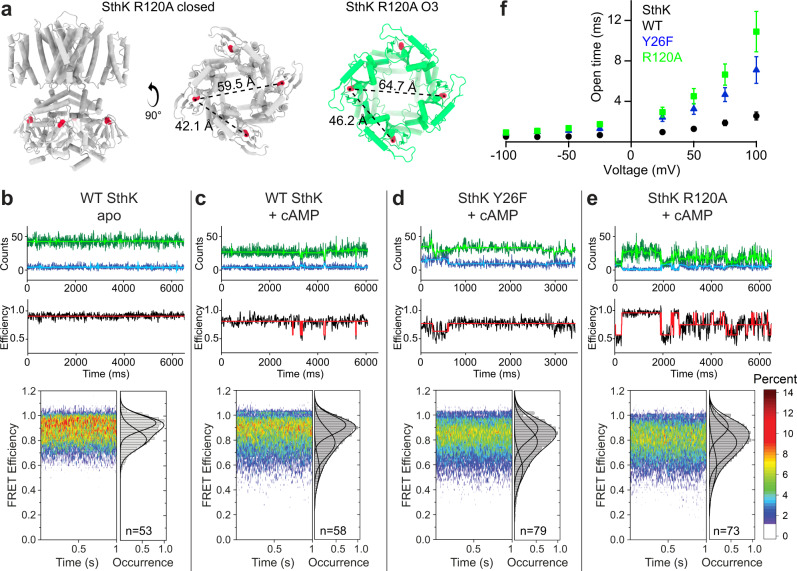
Fig. 4. Identification of gating intermediates in WT SthK.
a SthK R120A in closed (gray) and open state (O3, green) are shown with Cys387 for fluorophore labeling highlighted (red). Distances between Cys387 from adjacent and opposing subunits are given for both states. b–e Top row: representative sm-FRET donor (blue) and acceptor (green) traces, as well as denoised traces (light blue and light green, respectively). Middle row: observed FRET efficiencies and idealized traces (black and red, respectively). Bottom row: distributions of observed FRET efficiencies displayed as sm-FRET contour plots and cumulative population histograms (gray) generated from the compilation of all analyzed single-molecule traces, with n indicated in the panels. Population histograms were fitted with Gaussian functions and parameters are summarized in Supplementary Table 4. f Open dwell times obtained from recordings as in Fig. 1d (see representative histograms in Supplementary Fig. 8f, g) for WT SthK (black), SthK Y26F (blue), and SthK R120A (green) are plotted as function of the applied voltage. Symbols represent mean ± SEM, n = 4–9 independent experiments for all data points. Source data are available as a Source Data file.

