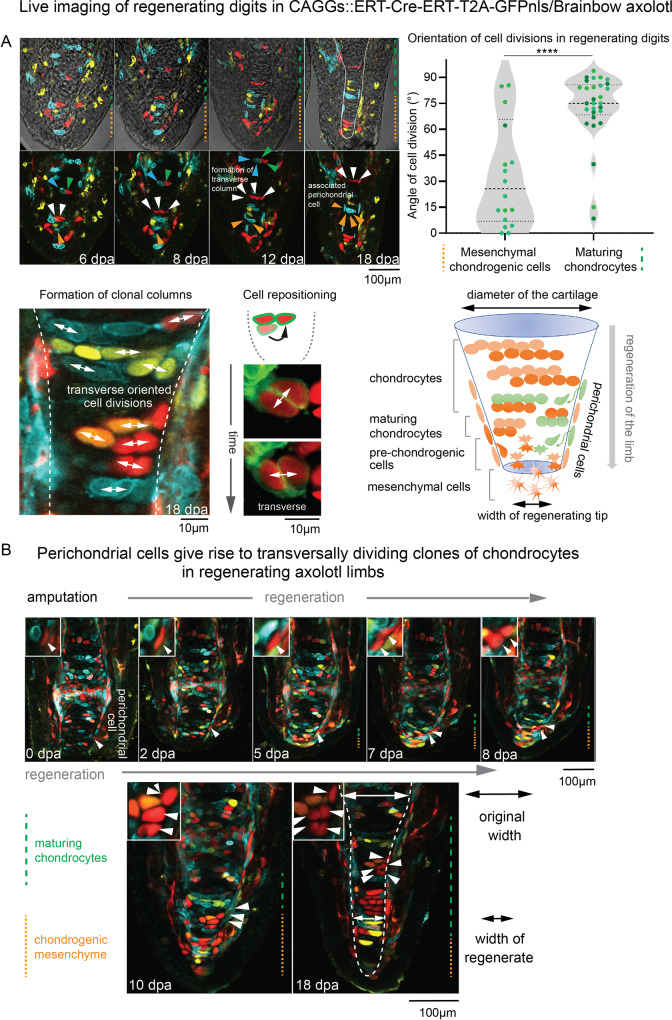
Fig. 3. Cell dynamics during skeletal elongation in Ambystoma mexicanum.
A Live imaging of cell dynamics in the regenerating digits of genetically traced regenerating Brainbow axolotl. The RFP+ (marked with white arrows) and CFP+ (pointed by orange arrows) mesenchymal chondrogenic cells give rise to transverse clonal chondrocytic columns. Note the remaining association of a CFP+ perichondral cell and clonal chondrocytes during cartilage growth, as pointed by orange arrows. On the right, violin plots represent the predominant orientation of clones. The preferred direction of daughter cell allocation after cell division is longitudinally oriented in the mesenchymal chondrogenic cells (left violin plot) and transversally oriented in the maturing chondrocytes (right violin plot). Two-tailed t-test, ****p < 0.0001. Each data point represents the orientation of a cell division, measured from n = 3 different limbs. Median and quartiles are represented as dashed and dotted lines, respectively. Lower panels illustrate how the diameter of regenerated cartilage increases with time, coinciding with the onset of transverse allocations of clonal progeny. The white line shows the border of the cartilage. The image at the bottom left of panel A illustrates the formation of clonal columns and corresponds to an area shown at high magnification from panel B at 18d.p.a.; cell repositioning is presented as individual planes from z-stack files from the same live-imaging series. B Cell dynamics in the regenerating digits (till 18d.p.a.) of genetically traced regenerating Brainbow axolotl. White arrowheads indicate an RFP+ perichondral cell giving rise to a clone of chondrocytes. This area is magnified in the corresponding insets. Orange dotted line shows the area of chondrogenic mesenchymal cells at the tip of regenerating skeletal element. Green dashed line shows maturing chondrocytes in regenerating skeletal element.

