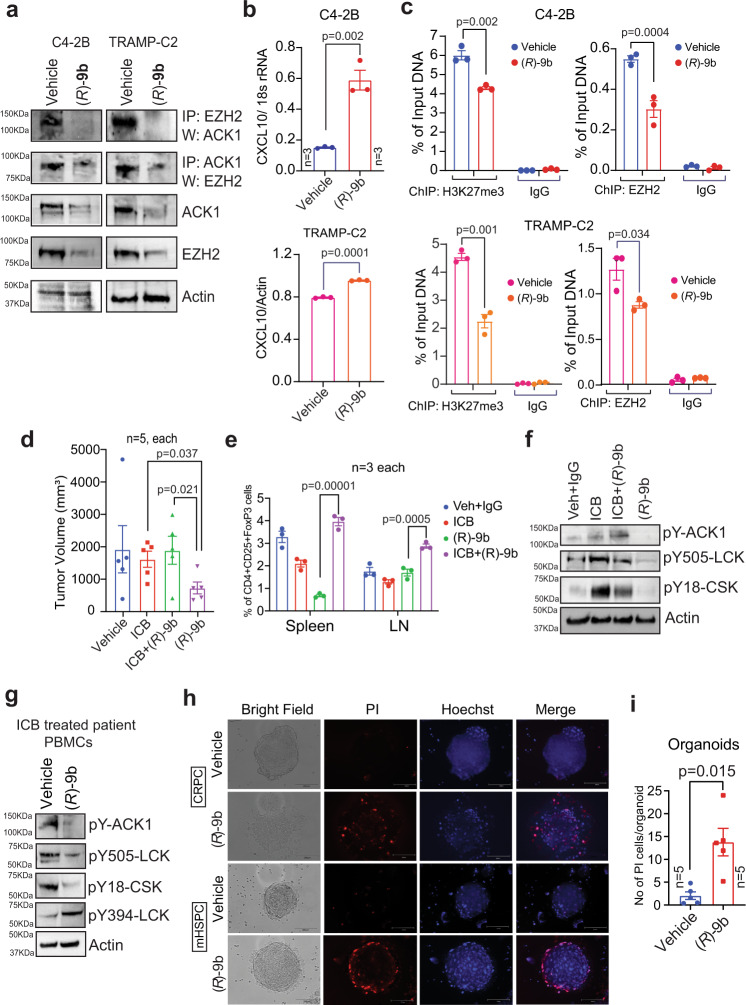
Fig. 7. Pharmacological ablation of ACK1 activates CXCL10 in tumors endows human PBMCs with enhanced T cell responsiveness and compromise prostate cancer organoid growth.
a C4-2B and TRAMP-C2 cells were treated with either vehicle (DMSO) or (R)-9b. Lysates were immunoprecipitated with ACK1 or EZH2 antibody, followed by immunoblotting with indicated antibodies. Representative images are as shown (n = 3 biologically independent experiments). b C4-2B and TRAMP-C2 cells were treated with either vehicle (DMSO) or (R)-9b. Total RNA was isolated, followed by qRT-PCR with CXCL10 and actin or 18s rRNA primers (n = 3 biologically independent samples, 3 replicates). c C4-2B and TRAMP-C2 cells were treated with either vehicle or (R)-9b, and harvested. The lysates were subjected to ChIP using H3K27me3 and EZH2 antibodies, followed by qPCR with primers for CXCL10 promoter region (n = 3 biologically independent samples, 3 replicates). d TRAMP-C2 cells were implanted subcutaneously in 6- to 8-week-old C57BL/6 male mice and were injected with vehicle (6% Captisol)+IgG antibodies, (R)-9b, αPD-1 and αCTLA-4 antibodies (ICB), or its combination with (R)-9b (n = 5 mice in each group). e Splenocytes were isolated and lymph nodes were drained to assess the Treg (CD4+CD25+FoxP3+) population (n = 3 mice in each group). f Representative immunoblots of spleen lysates from mice described above are shown (n = 3 biologically independent experiments). g PBMCs were isolated from blood of ICB treated mHSPC patient. The PBMCs were treated with (R)-9b for 6 h and immunoblotting was performed with the indicated antibodies. h The PBMCs from prostate cancer patients were treated with vehicle or (R)-9b for 6 h, washed and co-cultured with prostate cancer organoids. After 24 h, the organoids were stained with PI and Hoechst 33258 and observed under fluorescent microscope. Representative images are as shown (n = 3 biologically independent experiments). i Quantitation of the data shown in h. For b–e and i the data are represented as mean ± SEM and p values were determined by unpaired two-tailed Student’s t-test. Source data are provided as a Source Data file.

