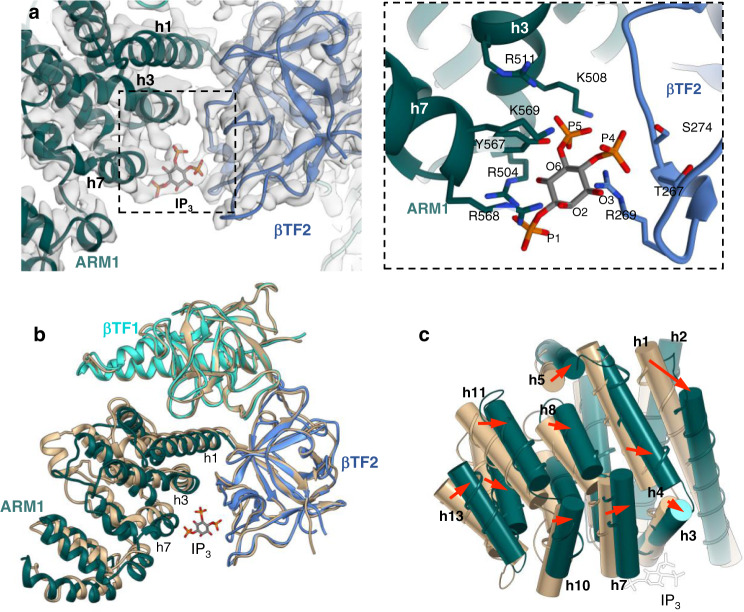
Fig. 2. IP3 induced conformational changes in the ligand binding pocket.
a The IP3 molecule is fitted to the density bridging βTF2 and ARM1 domains in the CIA-IP3R1 cryo-EM map overlaid with the corresponding molecular model (left panel). Zoomed-in view of the IP3 binding pocket structure with coordinating side-chain residues indicated (right panel). b Alignment of CIA-IP3R1 and Ca-IP3R1 models at the βTF1 domain shows the closure of the IP3 binding pocket and nearly identical βTF1 and βTF2 backbone structures. c ARM1 helices in CIA-IP3R1 are shifted toward the occupied ligand binding pocket. ARM1 domains (CIA-IP3R1 colored green; Ca-IP3R1 colored tan) are shown as thin ribbons overlaid with helices rendered as cylinders and numbered sequentially within the domain. The IP3 molecule is white.

