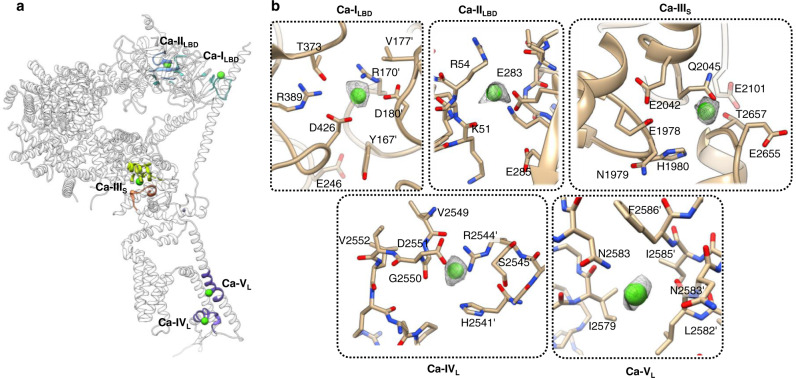
Fig. 3. Ca2+ binding sites in Ca-IP3R1.
a Overall topology of Ca2+ binding sites is shown for a single subunit of IP3R1 (white ribbon) with the region surrounding the Ca2+ binding site highlighted in the corresponding domain color: Ca-ILBD and Ca-IILBD sites in the ligand binding domains (blue/turquoise); Ca-IIIs site in the Ca2+ sensor region located within the ARM3 domain (lime green/orange); Ca-IVL and Ca-VL sites in luminal vestibule of the TMD (purple). b Zoomed-in views of the Ca2+ binding sites. Ca2+ ions are shown as green spheres and overlaid with corresponding densities displayed at 2-5 σ cutoff values. Residues within 5 Å of the Ca2+ ions are displayed in a stick representation and labeled.

