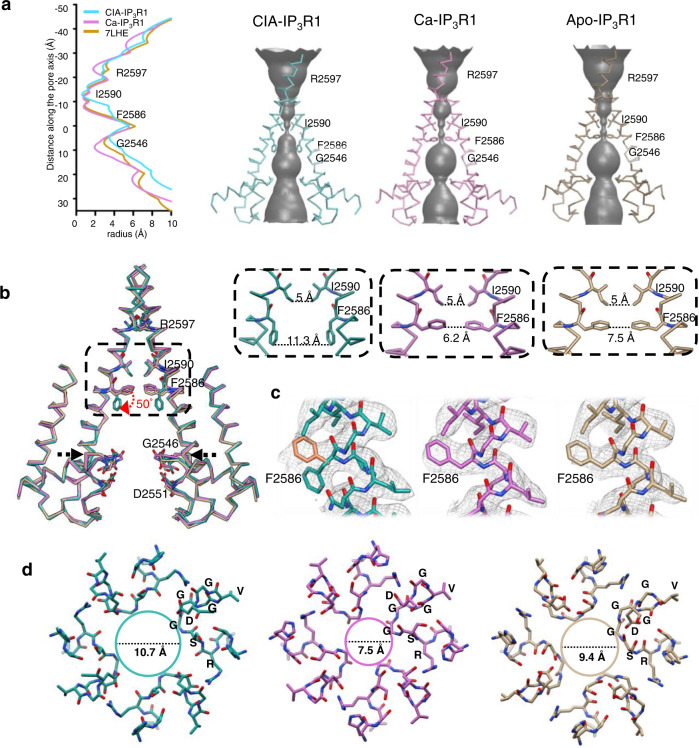
Fig. 5. Ion conduction pathway in IP3R1 upon ligand binding.
a Solvent-accessible pathways in CIA-IP3R1, Ca-IP3R1 and apo-IP3R1. The left panel plots the pore dimensions along the ion conduction pathway and the right panels reveal the solvent accessible volume. b The ion conduction pathways in CIA-IP3R1 (blue-green), Ca-IP3R1 (pink), apo-IP3R1 (PDB ID: 7LHE, tan) are aligned and overlaid. The backbone structures for two opposing subunits with several solvent lining side chains are shown and labeled. Red arrow indicates the change in side chain position of F2586 observed in CIA-IP3R1. Upper right panels show zoomed in views of the area indicated by the box in the left panel. Distances across the ion conduction pathway at I2590 and F2586 are measured from side-chain atoms from two opposite subunits. c Cryo-EM densities overlaid with atomic models for the TM6 gate residue F2586. Two rotamers of F2586 (orange and blue-green) are shown for CIA-IP3R1. Densities in Ca-IP3R1 and apo-IP3R1 permit only one rotamer fit for F2586. d Luminal view of the selectivity filter (2544-RSGGGVGD−2551) for CIA-IP3R1, Ca-IP3R1, and apo-IP3R1 at the region indicated by black arrows in ‘b’ and colored respectively. Distance across the SF is measured between the G2546 Cα atoms from two opposite subunits.

