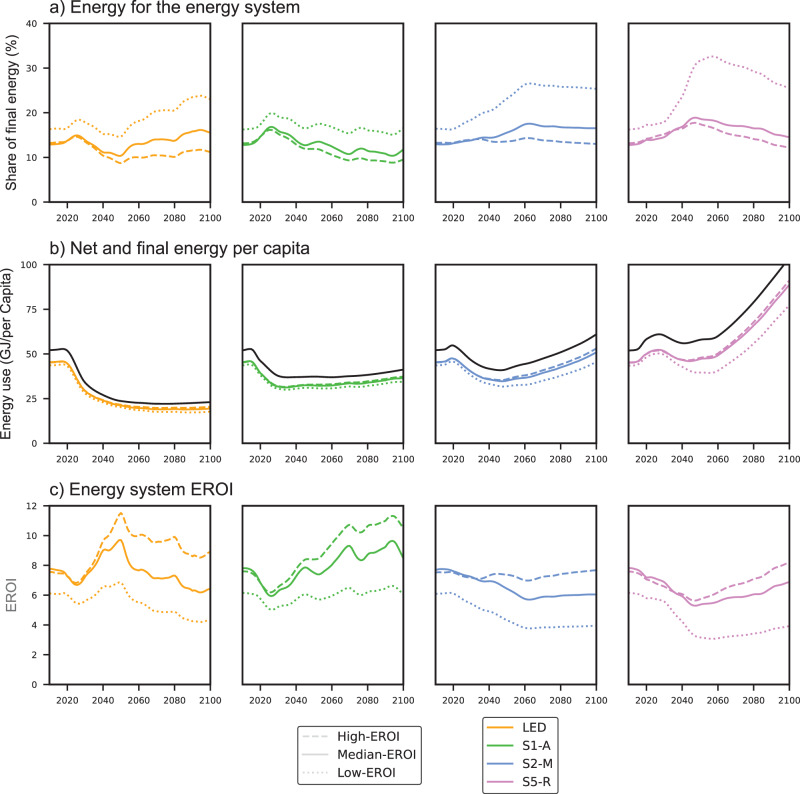
Fig. 4. Share of energy for the energy system, net energy per capita, and EROI of the energy system for the four illustrative pathways.
Panel a shows the share of final energy that is required for the construction and operation of the energy system. Panel b shows final energy per capita (solid black line), and how much of it will be left for society as net energy per capita. Panel c shows the evolution of the EROI of the overall energy system. All panels show a range of three estimates: high-EROI (dashed line), median-EROI (solid line), and low-EROI (dotted line).

