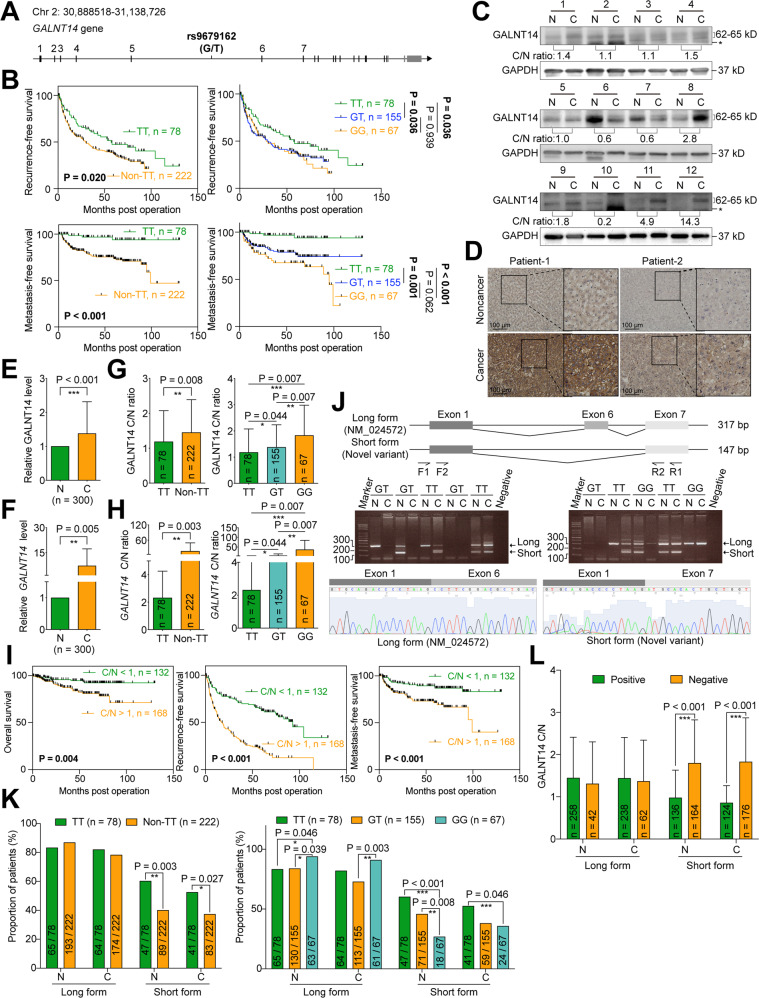
Fig. 1. Higher cancerous/noncancerous ratios for GALNT14 and the rs9679162-non-TT genotype are associated with unfavorable postoperative outcomes in patients with HCC.
A Genomic structure of the GALNT14 locus. Black vertical lines indicate predicted translatable regions, while gray lines indicate non-coding regions. B Kaplan–Meier analysis of postoperative outcomes in patients with HCC stratified according to rs9679162 genotypes. P values were obtained by log-rank test. C Representative images of western blots of patient samples. N noncancerous part, C cancerous part. The anti-GALNT14 reactive bands migrating between 62-65 kD were verified to be GALNT14-derived protein species by mass spectrometry. However, the band migrating below 62 kD, marked by “*”, was not GALNT14-related. D Representative IHC images obtained from patients with HCC are shown. Statistical comparison of GALNT14 protein (E) and mRNA (F) levels between noncancerous (N) and cancerous (C) tissues. P values were calculated by paired two-tailed student’s t test. Cancerous/noncancerous (C/N) ratios of GALNT14 in protein (G) and mRNA (H) levels were compared between rs9679162-TT and non-TT (GT or GG) genotypes. P values were calculated by the two-tailed Mann–Whitney U test. I Kaplan–Meier analysis of overall (left), recurrence-free (middle), and metastasis-free (right) survival, stratified by the cancerous/noncancerous (C/N) ratio of GALNT14. P values were calculated by log-rank test. J Schematic representation of alternative splicing occurring on designated exons, with exon-6 deleted in the short form GALNT14 mRNA (a novel variant). Agarose gel images show the presence of long (NM_024572, with product size 317 bp) and short (product size 147 bp) forms of GALNT14 mRNA in HCC tissues. K Comparison of the proportion of patients carrying the long and short forms of GALNT14 mRNA between the TT and non-TT (GG or GT) genotypes. Comparisons were made within the noncancerous (N) and cancerous (C) groups, respectively. P values were calculated by Fisher’s exact test. L Comparison of GALNT14 cancerous/noncancerous (C/N) ratios between patients positive and negative for the long or short form of GALNT14 mRNAs. Again, comparisons were made between the noncancerous (N) and cancerous (C) groups. P values were calculated by the two-tailed Mann–Whitney U test.

