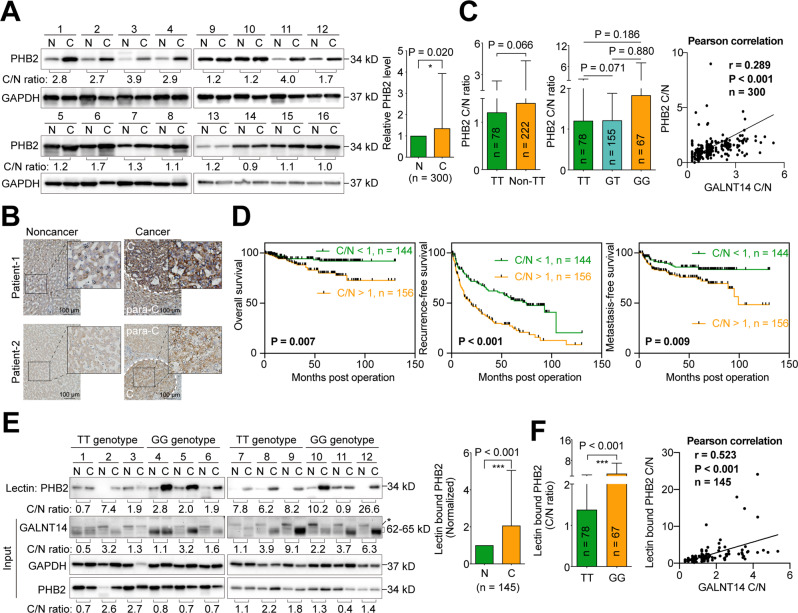
Fig. 6. PHB2 and its O-glycosylated forms are upregulated in HCC.
A Representative images of western blots of HCC patient samples. N noncancerous part, C cancerous part. Statistical comparison between PHB2 levels in the noncancerous and cancerous parts is given in the right panel. P values were calculated by paired two-tailed student’s t test. B Representative IHC images of HCC patient tissues. The scale bar is given in the right lower corner. C cancerous tissue, para-C para-cancerous tissue. C Statistical comparison of PHB2 cancerous/noncancerous (C/N) ratios between tissues from patients with the indicated rs9679162 genotypes (left and middle panel). P values were calculated by the two-tailed Mann–Whitney U test. The C/N ratios of GALNT14 protein and PHB2 protein were correlated using the Pearson correlation (right panel). D Kaplan–Meier analysis of overall (left), recurrence-free (middle), and metastasis-free (right) survival, stratified by the C/N ratio of PHB2 protein. P values were calculated by log-rank test. E Representative image of western blots of samples of lectin pulldown assays using lysates extracted from HCC tissues (upper panel). A statistical comparison of PHB2 protein levels between the noncancerous (N) and cancerous (C) tissues is given in the right panel. P value was calculated by paired two-tailed student’s t test. F Statistical comparison of the C/N ratio of lectin-bound PHB2 in HCC tissues between patients with the indicated rs9679162 genotype (left panel). The C/N ratios of GALNT14 protein and lectin-bound PHB2 protein were correlated using the Pearson correlation (right panel). TT rs9679162-TT genotype, Non-TT rs9679162-non-TT genotype, GT rs9679162-GT genotype, GG rs9679162-GG genotype.

