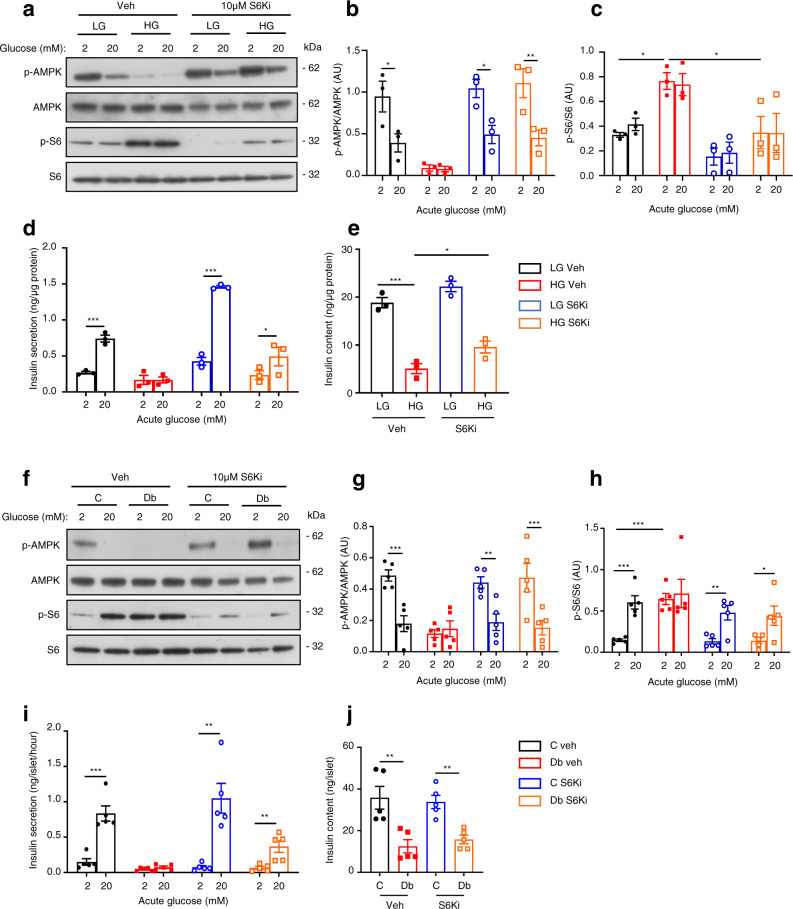
Fig. 7. S6-kinase inhibition partially reverses the effects of chronic hyperglycaemia.
a Representative Western blot of lysates from LG- and HG-cells cultured for 48 h ± 10 µM of the S6-kinase inhibitor PF-4708671 (S6Ki), and then stimulated with 2 mM or 20 mM glucose for 1 h in the absence of S6Ki. Phosphorylated (p) and total AMPK and S6. Uncropped blots in source data. b, c Quantitative densitometry analysis of p-AMPK/AMPK (b, n = 3 biologically independent experiments) and p-S6/S6 (c, n = 3 biologically independent experiments). LG-cells (black), HG-cells (red), LG-cells+S6Ki (blue), HG-cells+S6Ki (orange). d Insulin secretion and (e) insulin content from LG- and HG-cells cultured for 48 h ± 10 µM S6Ki and stimulated with 2 or 20 mM glucose for 30 min in the absence of S6Ki (n = 3 biologically independent experiments). f Representative Western blot of lysates from control (C) and diabetic (Db) islets incubated for 48 h ± 10 µM S6Ki and then stimulated with 2 mM or 20 mM glucose for 1 h in the absence of S6Ki. Phosphorylated (p) and total AMPK and S6. Uncropped blots in source data. g, h Quantitative densitometry analysis of p-AMPK/AMPK (g, n = 5, 13–16 animals/genotype) and p-S6/S6 (h, n = 5, 15–18 animals/genotype). Control islets (black), Diabetic islets (red), Control islets + S6Ki (blue), Diabetic islets + S6Ki (orange). i Insulin secretion and j insulin content from control and diabetic islets incubated for 48 h ± 10 µM S6Ki and then stimulated with 2 mM or 20 mM glucose for 1 h (n = 5 animals/genotype). All panels show individual data points and mean ± s.e.m. *P < 0.05, **P < 0.01, ***P < 0.001, two-tailed unpaired Student’s t test. Veh, vehicle (0.05% DMSO). Source data are provided as a Source Data file.

