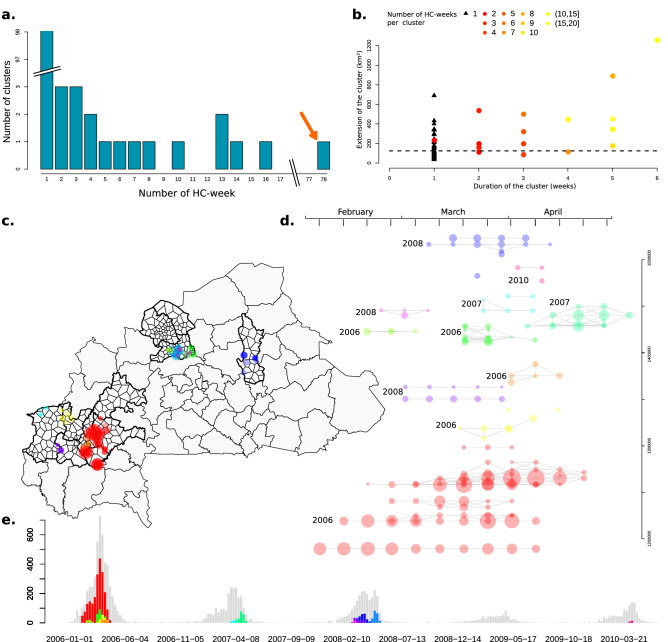
Figure 1.
Temporal and spatial dynamics of localized epidemics and localized meningitis epidemic clusters (LEC) in 14 health districts, Burkina Faso, 2004–2014. (a) Distribution of the number of epidemic HC-week per epidemic cluster. Orange arrow: 2006 epidemic event. (b)Temporal and spatial extension of epidemic clusters. The 2006 epidemic cluster has been omitted for visibility. (c) Localization of selected LCE which comprised > 1 HC week. Bold line: borders of the selected districts. (d)Temporal and spatial dynamics among LCE comprising > 1 HC week. The clusters are vertically positioned according to geographic latitude and horizontally according to calendar week. The size of the dots represents the number of cases and connected by a line if the HC centroids are less than 14 km apart. (e)Temporal occurrence of LCE comprising > 1 HC week. Grey bars: weekly number of cases within the study area. Coloured bars: weekly number of cases per epidemic cluster (stacked).

