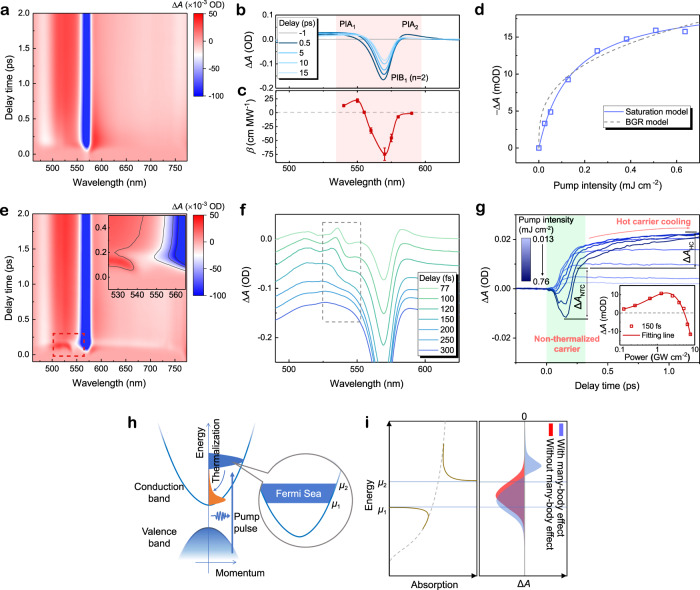
Fig. 3. Ultrafast TA measurement of quasi-2D perovskite film.
a Representative pseudocolour TA spectrum and b Time-dependent photo-induced changes in absorption (ΔA) which is pumped by 400 nm femtosecond laser with excitation fluence around 0.64 mJ cm−2. c NLA coefficients extracted from Z-scan measurements. Error bars represent the fitting uncertainties with standard NLA model. d Experimental ΔA data (blue hollow dots) of PIA1 peak (530 nm) at 200 fs delay as a function of pump intensity fitted by the band-gap renormalization (BGR) model (gray dash line) of ΔA = A × I1/3 and standard saturation model (blue solid line) of , where B are constant, IS is saturable intensity with a value of 0.16 mJ cm−2 (1.62 GW cm−2). e Pseudocolour representation of TA spectrum pumped by 540 nm femtosecond laser with an excitation intensity of 0.76 mJ cm−2. Inset: enlarged TA spectrum of the part labeled by the red frame. f ΔA spectra evolution within the first 300 fs and g pump fluence dependent kinetics curves probed at 540 nm extracted from e. Green region highlights the non-thermalization carrier kinetics within the first 300 fs. Red arrow in g outlines the subsequent hot-carrier cooling process after thermalization. The non-thermalized carriers and hot carriers induced absorbance difference is labeled by ΔANTC and ΔAHC. Inset: power dependent ΔA (hollow dots) at 150 fs delay fitted with Eq. 2 (red solid line). h The schematic shows the initial intra-band carrier relaxation process. i Sketched absorption spectrum based on nonequilibrium Fermi-sea. The left panel denotes the absorption singularities appear near the upper and lower boundary. The right panel demonstrates ΔA spectra with/without many-body interaction in the presence of a gaussian type non-thermalized carrier distribution.

